


The regime-change series.
Part I (you are here) asked why the price of money changed (our most read article)
Part II asked who has to sell into it and the 6 Themes to Own for the Next Regime.
Part III asked the question underneath both.
WHAT IF the biggest bubble of our lifetime isn't crypto?
Not AI stocks.
Not real estate.
What if it's the one asset every pension fund, every retiree, every "safe" portfolio is loaded with?
Bonds.
Everyone is watching AI, crypto and the next equity bubble. The bigger story may be hiding inside the asset still labelled “safe”. The 1981–2020 collapse in yields was not just a bond bull market. It was the discount-rate regime in which passive investing, long-duration growth, serial acquisition models and the modern 60/40 portfolio came of age.
Most investors have never managed money in a rising rate world.
Their entire career happened inside the bull.
The unwind has barely started.
And no one is talking about it.
This is the price of time, the return of inflation, the danger of extrapolating yesterday’s winners — and why a harder market could be a much better one for stock pickers.
“The only constant is change.”
— attributed to Heraclitus
20 April 2020.
A barrel of West Texas Intermediate crude oil became worth less than nothing.
Not cheap. Not very cheap. Less than nothing.
The May WTI contract settled at -$37.63 a barrel as collapsing demand, scarce storage and an expiring futures contract collided in one of the strangest prints in market history.
Imagine driving into a petrol station in Zurich, filling the Tiguan, and having the cashier hand you $85.
That is not quite how oil futures work. But you get the point.
One of the world’s most important physical commodities had become almost worthless. At almost exactly the same moment, one of the world’s most important financial prices was approaching the same destination.
Money had become almost free.
US Treasury yields collapsed. Central banks flooded the system with liquidity. Governments borrowed sums previously reserved for wars. Investors paid extraordinary prices for cash flows far into the future.
Oil: unwanted. Money: almost free.
If you wanted to design the final scene of a financial era, it would be difficult to improve on the spring of 2020.
Because something else was ending.
The greatest bond bull market of our investing lives.
The chart that changes the story
Forget the next Fed meeting for a moment. Forget whether the chairman says “patient”, “data-dependent” or whatever phrase Bloomberg decides deserves a red headline.
Zoom out. Far out.
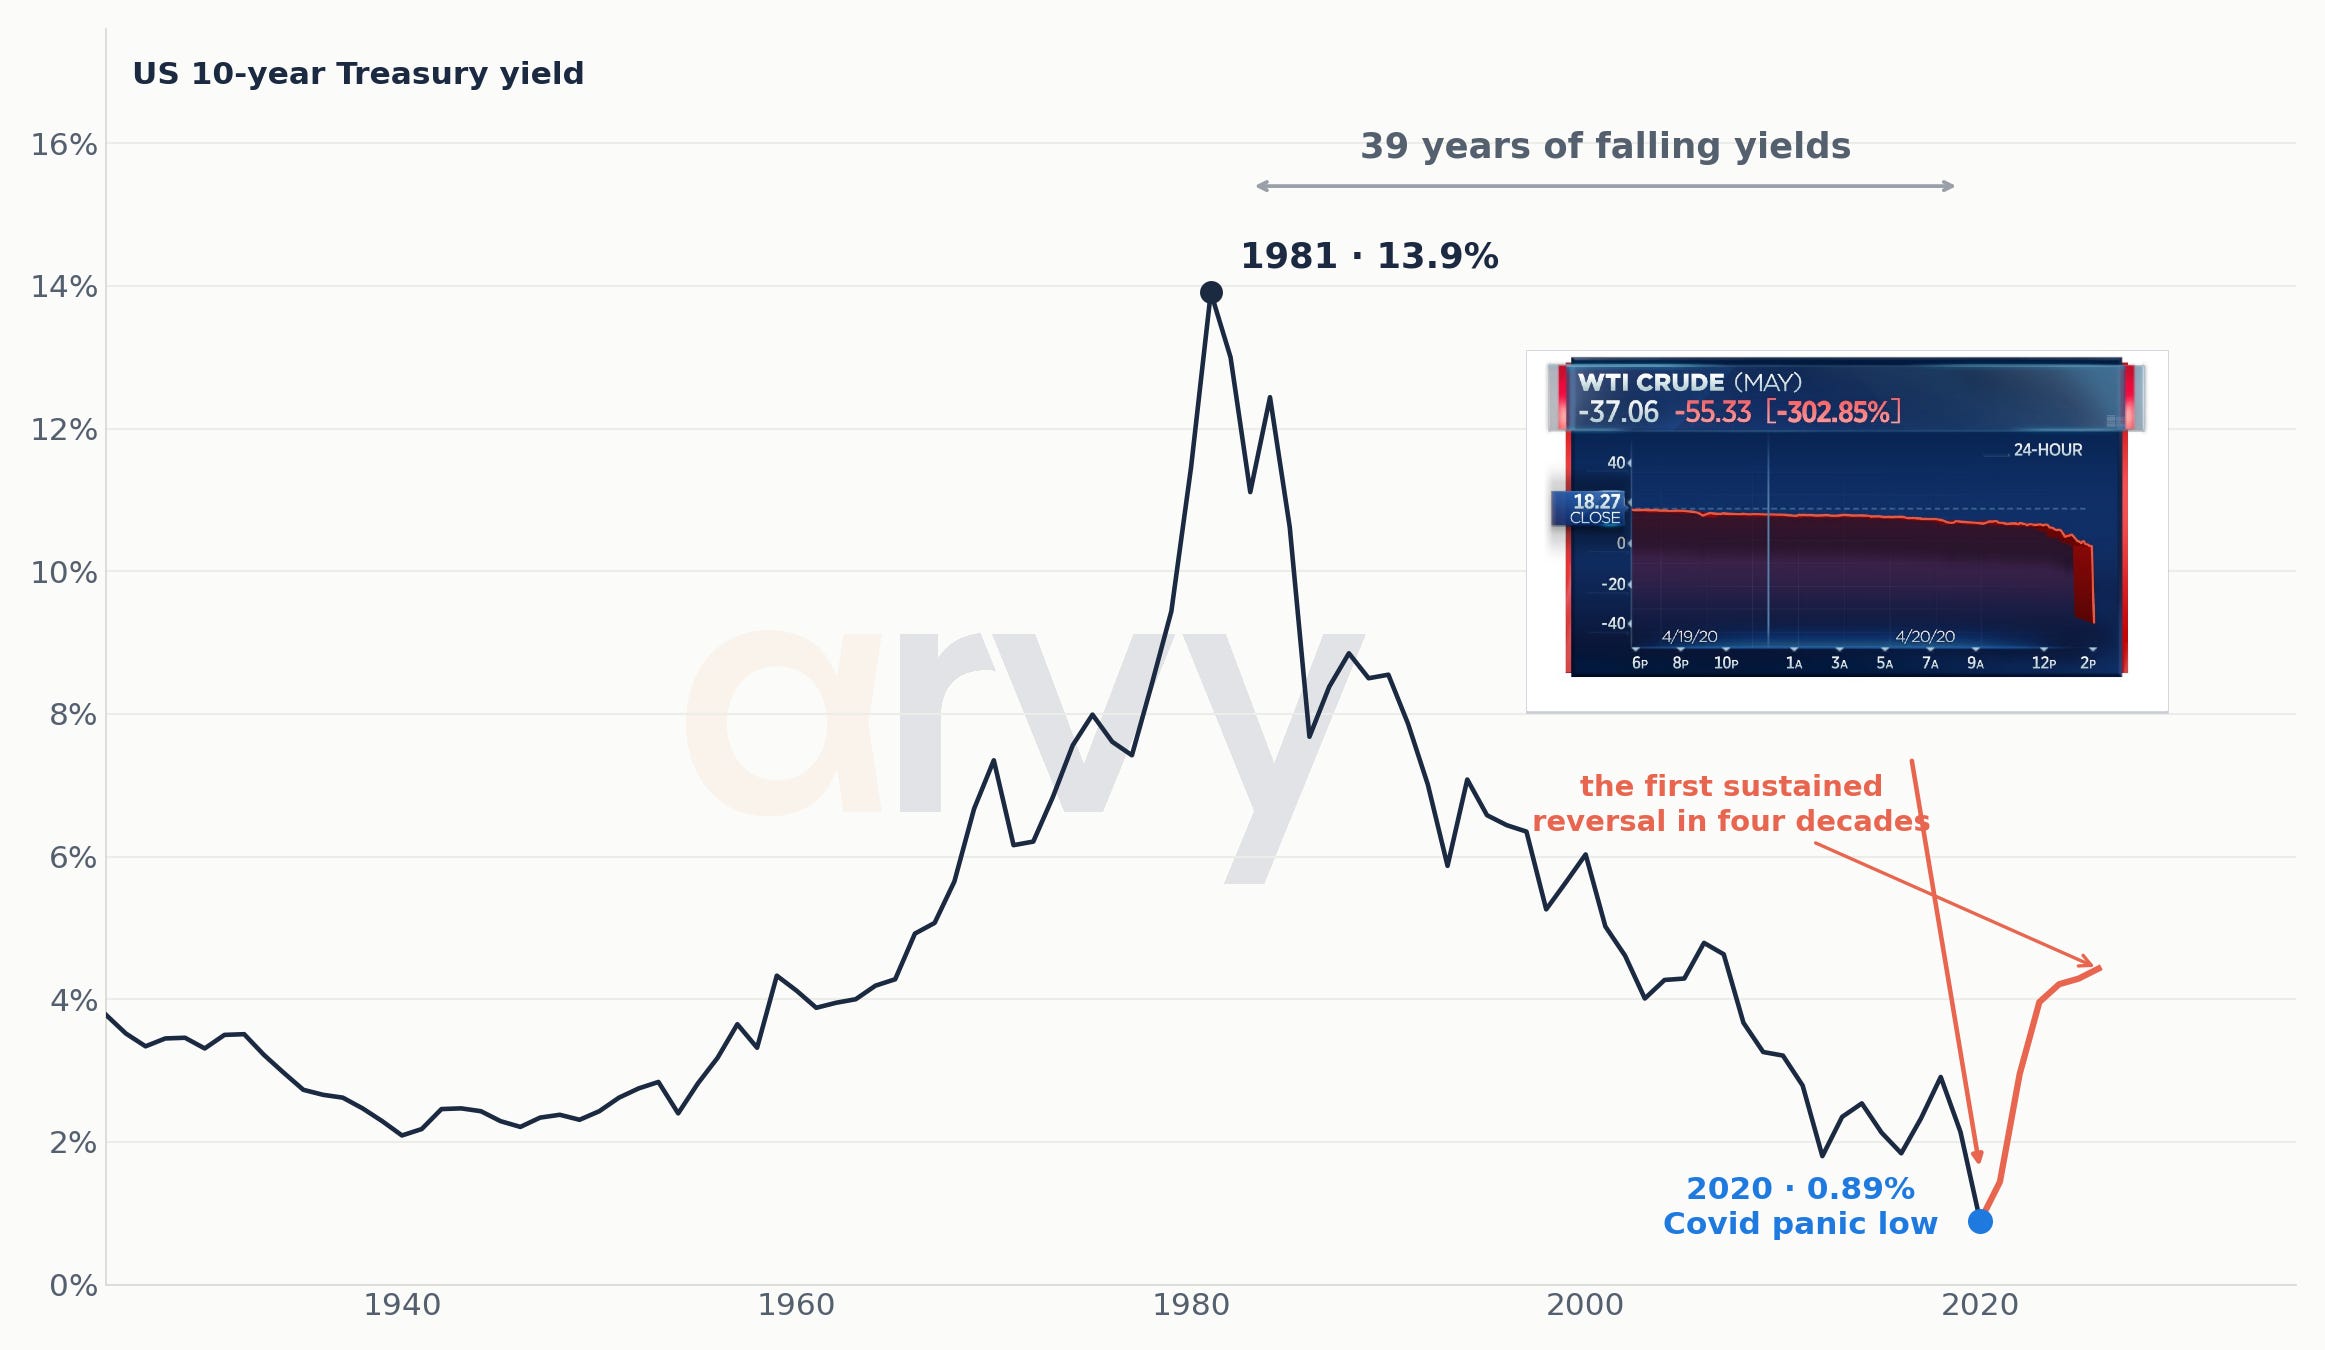
Chart 1: US 10-year Treasury yields: the 39-year bull market in bonds ends near the Covid panic low
Source: FRED (GS10), Homer & Sylla, Global Financial Data · arvy
The 1981 peak and 2020 low are the hinge of the argument: a four-decade fall in the price of money, followed by the first durable reversal in a generation.
The 1981 top printed yields around 15%. The 2020 panic pushed the 10-year close to 0.5%. In between sat almost four decades in which the broad direction of the most important discount rate in finance was down.
It was not a straight line. Nothing useful in markets ever is.
But it was persistent enough to become invisible.
An entire generation of investors learned its craft inside the same secular wind.
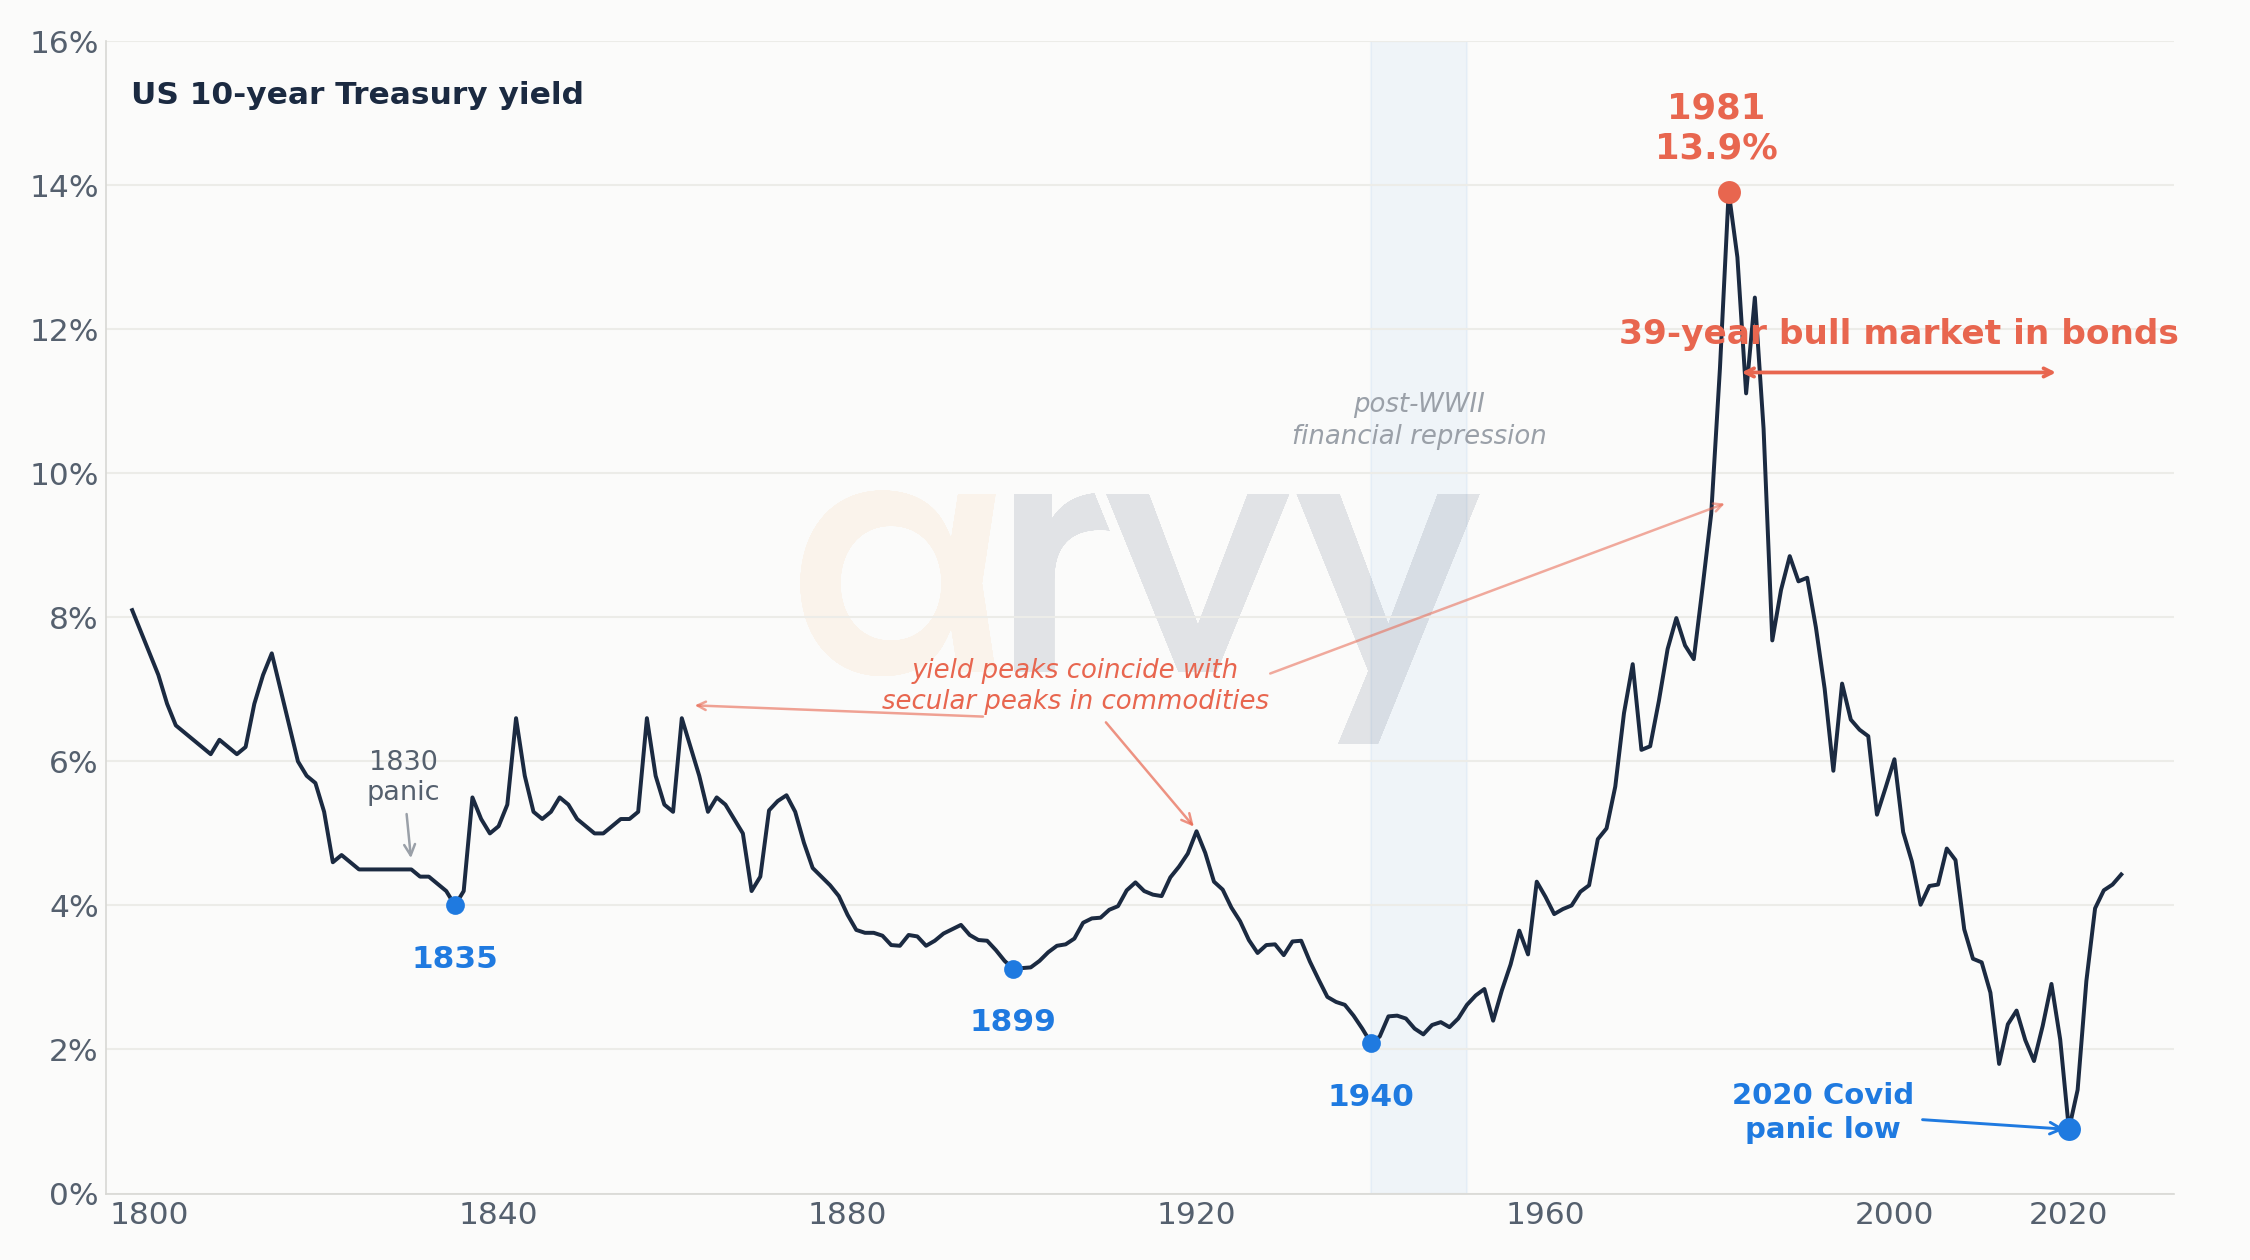
Chart 2: Two centuries of US long-bond yields — the long cycle view
Source: Homer & Sylla, Global Financial Data, FRED · arvy. Pre-1953 observations are reconstructions.
The exact pre-1950 instrument changes across historical reconstructions. The broad point is regime, not false precision: yields have moved through multi-decade secular rises and falls before.
There is no single official 10-year Treasury series running cleanly back to 1800. Modern constant-maturity data begin in the 1950s; earlier observations are reconstructions using federal bonds, long government securities and historical proxies. That caveat matters. So does the shape.
The 19th century had wars, panics and a young borrower slowly earning credibility. The post-war era produced the Great Inflation. Volcker broke it. Then came the long descent from 1981 to 2020.
The mistake is not using history. The mistake is pretending history is a timetable.
So why call it the mother of all bubbles?
A fair question.
Bonds were not Pets. com. There were no sock puppets, no taxi drivers flipping Treasuries, no JPEGs selling for two million dollars.
But bubbles do not have to look ridiculous while they are happening.
At their core they are periods in which an assumption becomes so widely accepted that prices, portfolios and eventually entire business models are built around it.
The assumption of the last forty years was simple:
Interest rates go down.
From roughly 15% in 1981 to almost nothing in 2020, that assumption worked so consistently that it stopped feeling like an assumption at all. It became the floor everyone stood on.
And this is why I call it the mother of all bubbles.
Falling bond yields did not inflate only bond prices. They lowered the discount rate underneath almost everything else. Houses became affordable at higher prices. Equities deserved higher multiples. Private equity could borrow more. Governments could carry more debt. Unprofitable growth companies could sell a distant future more easily. Serial acquirers could turn cheap financing into an operating model.
The bond bubble did not sit beside the other asset bubbles. It sat underneath them.
The price of money became the price of everything.
And then, in 2020, the price of money reached almost zero. There was not much road left.
To be precise: I am not arguing that a 10-year Treasury yielding close to 5% is a bubble today. I am arguing that the 39-year bull market which took yields from 15% to almost nothing was the mother of all bubbles — because its consequences spread far beyond bonds.
Which bonds are we actually talking about?
This matters more than any single word in this essay. “The bond market” is not one object, and the argument below does not apply equally to all of it.
Bills and short paper (0–2y): the least exposed to a secular rate rise, and for the first time in fifteen years they pay a real yield while you wait.
Intermediate (2–5y): moderate sensitivity. A reasonable middle for investors who need ballast without taking the full duration bet.
Long nominal (10y+): the sleeve this essay is genuinely cautious about. It is the part that was rewarded for four decades and has the most to lose if the direction has changed.
Inflation-linked (TIPS): compensation for the specific risk the essay describes, rather than a bet against it.
Credit: carries the duration question plus a separate one about spreads and refinancing at higher rates.
If you hold a broad aggregate bond fund, you own a blend of these — typically with meaningful intermediate-to-long duration. That is the reader this piece is addressed to.
The greatest tailwind investors never knew they had
Imagine a business that will generate USD 100 ten years from now.
The factory does not change when the 10-year Treasury moves. The employees do not become less productive. Customers do not disappear.
But change one cell in the spreadsheet — the discount rate — and the present value of that USD 100 changes immediately.
That sounds like finance-school boredom. It is not. It is one of the most powerful forces in capitalism.
Lower rates make distant cash flows more valuable. They make mortgages cheaper. They reduce corporate borrowing costs. They make leveraged buyouts easier to justify. They allow governments to carry more debt. They make a 6% prospective return look exciting when cash yields nothing.
For forty years, that hurdle rate kept falling.
So did the hurdle investors demanded from almost everything else.
The bond bull was not just a bond story. It was a valuation story, a leverage story, a housing story, a private-equity story, a growth-stock story and, eventually, an indexing story.
For forty years, investors sailed with the wind at their backs.
Many became convinced they had invented faster boats.
The price of time
arvy Book Club: Edward Chancellor, The Price of Time — The Real Story of Interest

Source: Price of Time Cover, Edward Chancellor, arvy book club
Edward Chancellor wrote an entire book around one deceptively simple idea: interest is the price of time.
Money today is worth more than money tomorrow. If I give you USD 100 today and you return USD 100 twenty years from now, I have not made an investment. I have made a donation.
Interest compensates us for waiting. But it also does something bigger: it acts as capitalism’s hurdle rate.
We understand that prices contain information. Make petrol expensive and people drive less. Make labour expensive and companies automate. Make hotel rooms expensive and someone eventually builds another hotel.
Yet for years we behaved as though suppressing the price of money itself would have no consequences.
It did.
At a 1% risk-free rate, a prospective 6% return can look rather exciting. At 5%, considerably less so.
That is not ideology. That is arithmetic.
The price of time changes the price of everything else.
What makes The Price of Time more than a polemic is the sweep of it. Chancellor traces artificially low interest across centuries and finds the same pattern recurring, long before central banks existed:
Cheap money inflates asset prices — the South Sea Bubble, the 1920s, the 2010s all rhyme.
It misallocates capital — weak projects that should die instead survive, because the hurdle rate that would have killed them has been suppressed to nothing. He was writing about “zombie companies” before the term went mainstream.
It widens inequality — those who own assets when the discount rate collapses get spectacularly richer; those who hold cash and wages do not.
It punishes savers and rewards speculators — the prudent are made to feel like fools, over and over, until they give up and join the speculation at precisely the wrong moment.
His recurring warning: when the price of time is suppressed for long enough, capital allocation itself degrades. Leverage becomes a habit. Weak businesses outlive their usefulness. Asset prices detach from the discipline a normal hurdle rate would impose.
And crucially… crucially none of this looks like a problem while it’s happening.
It looks like a boom.
The physical world takes its turn
The other side of the story is commodities.
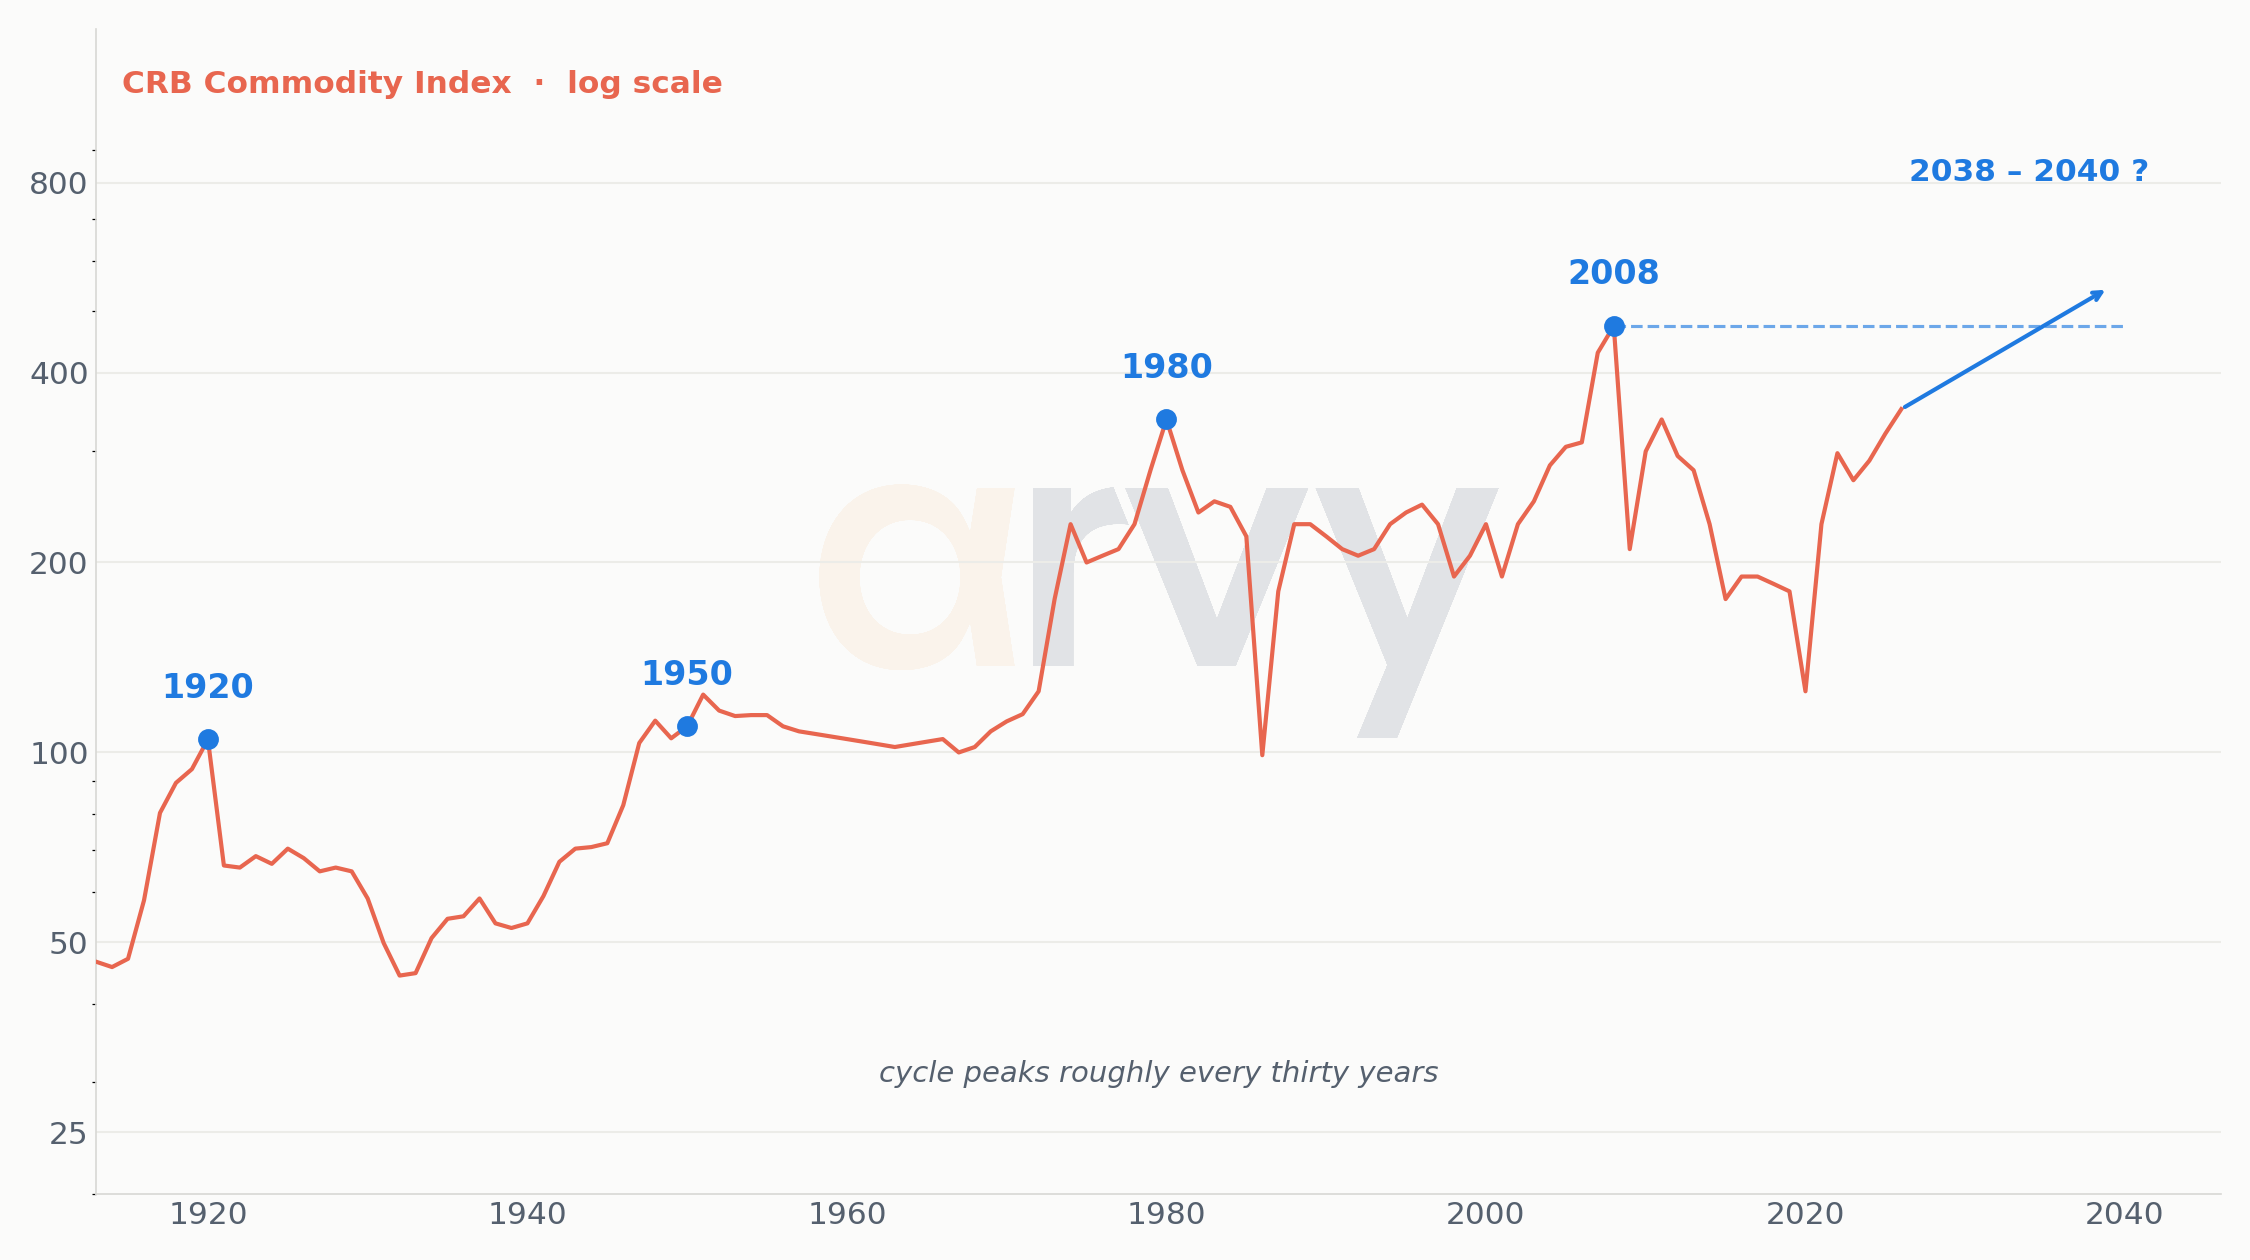
Chart 3: The CRB 30-year commodity cycle is turning up
Source: GMCP, CRB · arvy recreation. Forward cycle line is illustrative, not a forecast.
Cycle lines are illustrative, not a forecast. The useful observation is that physical-asset leadership has historically arrived in long waves.
You can draw a line through 1920, 1950, 1980 and 2008 and confidently predict 2040. You can also draw enough lines on a hundred-year chart and eventually become a macro strategist.
So let us not pretend the calendar is destiny.
But commodity bull markets do something financial-asset bull markets do not: they send an invoice to the rest of the economy.
Copper becomes wiring. Oil becomes transport. Gas becomes power. Steel becomes buildings. Coffee becomes the increasingly offensive price of a flat white in Zurich.
A rising Nvidia share price makes Nvidia shareholders richer. A rising oil price makes everyone else pay more.
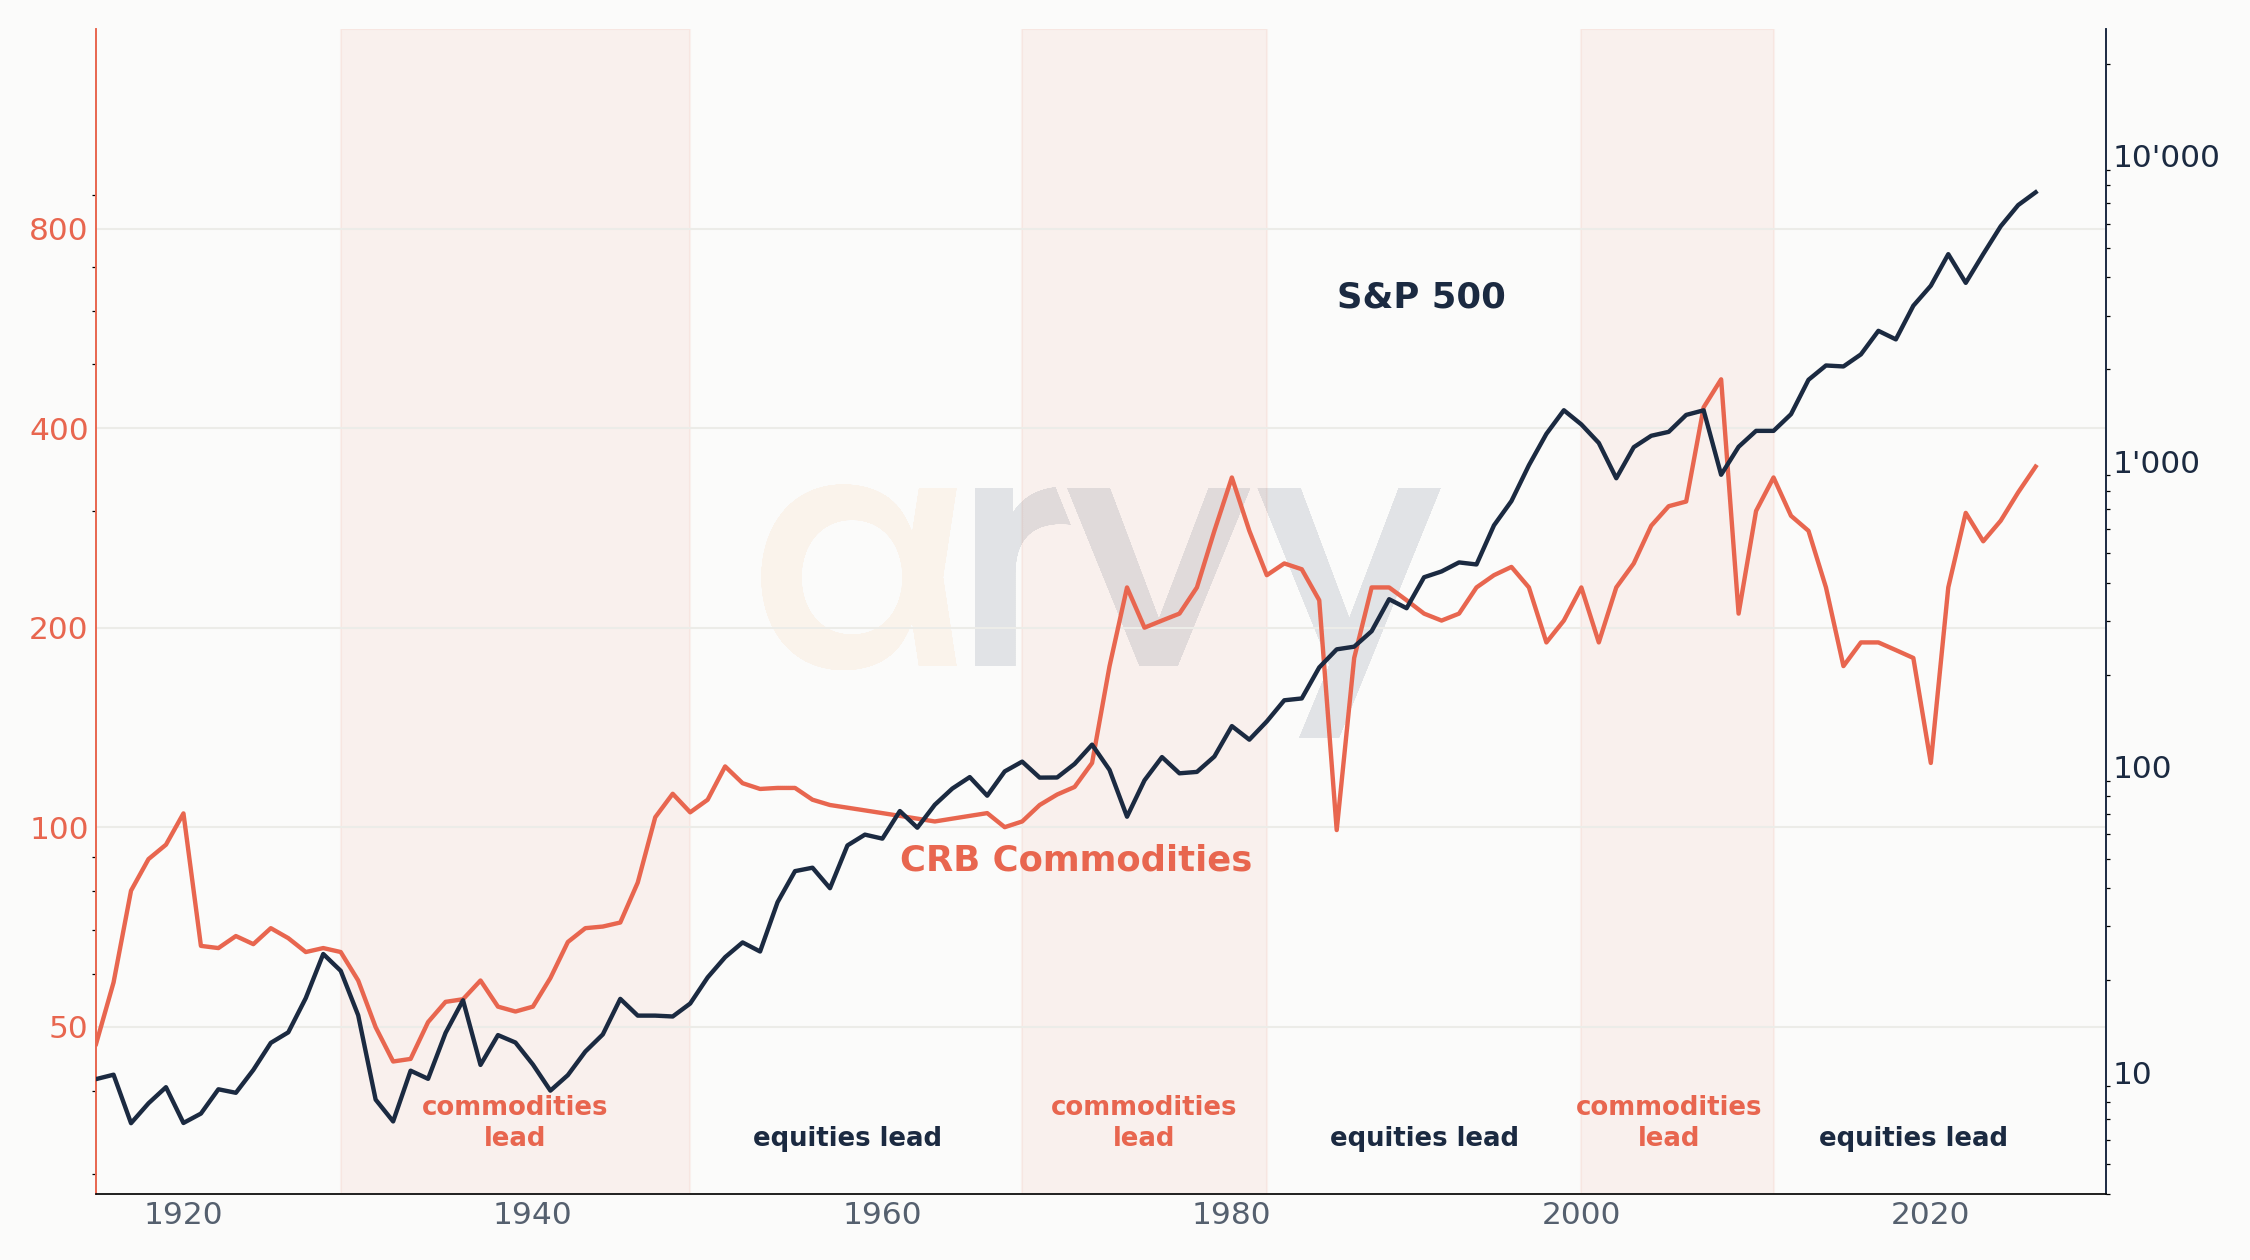
Chart 4a: Equities and commodities take turns, S&P 500 nominal, since 1915
Source: S&P Global, CRB, GMCP · arvy recreation. Regime lines are stylised secular trends.
Chart 4b: Equities and commodities take turns, S&P 500 real, since 1915
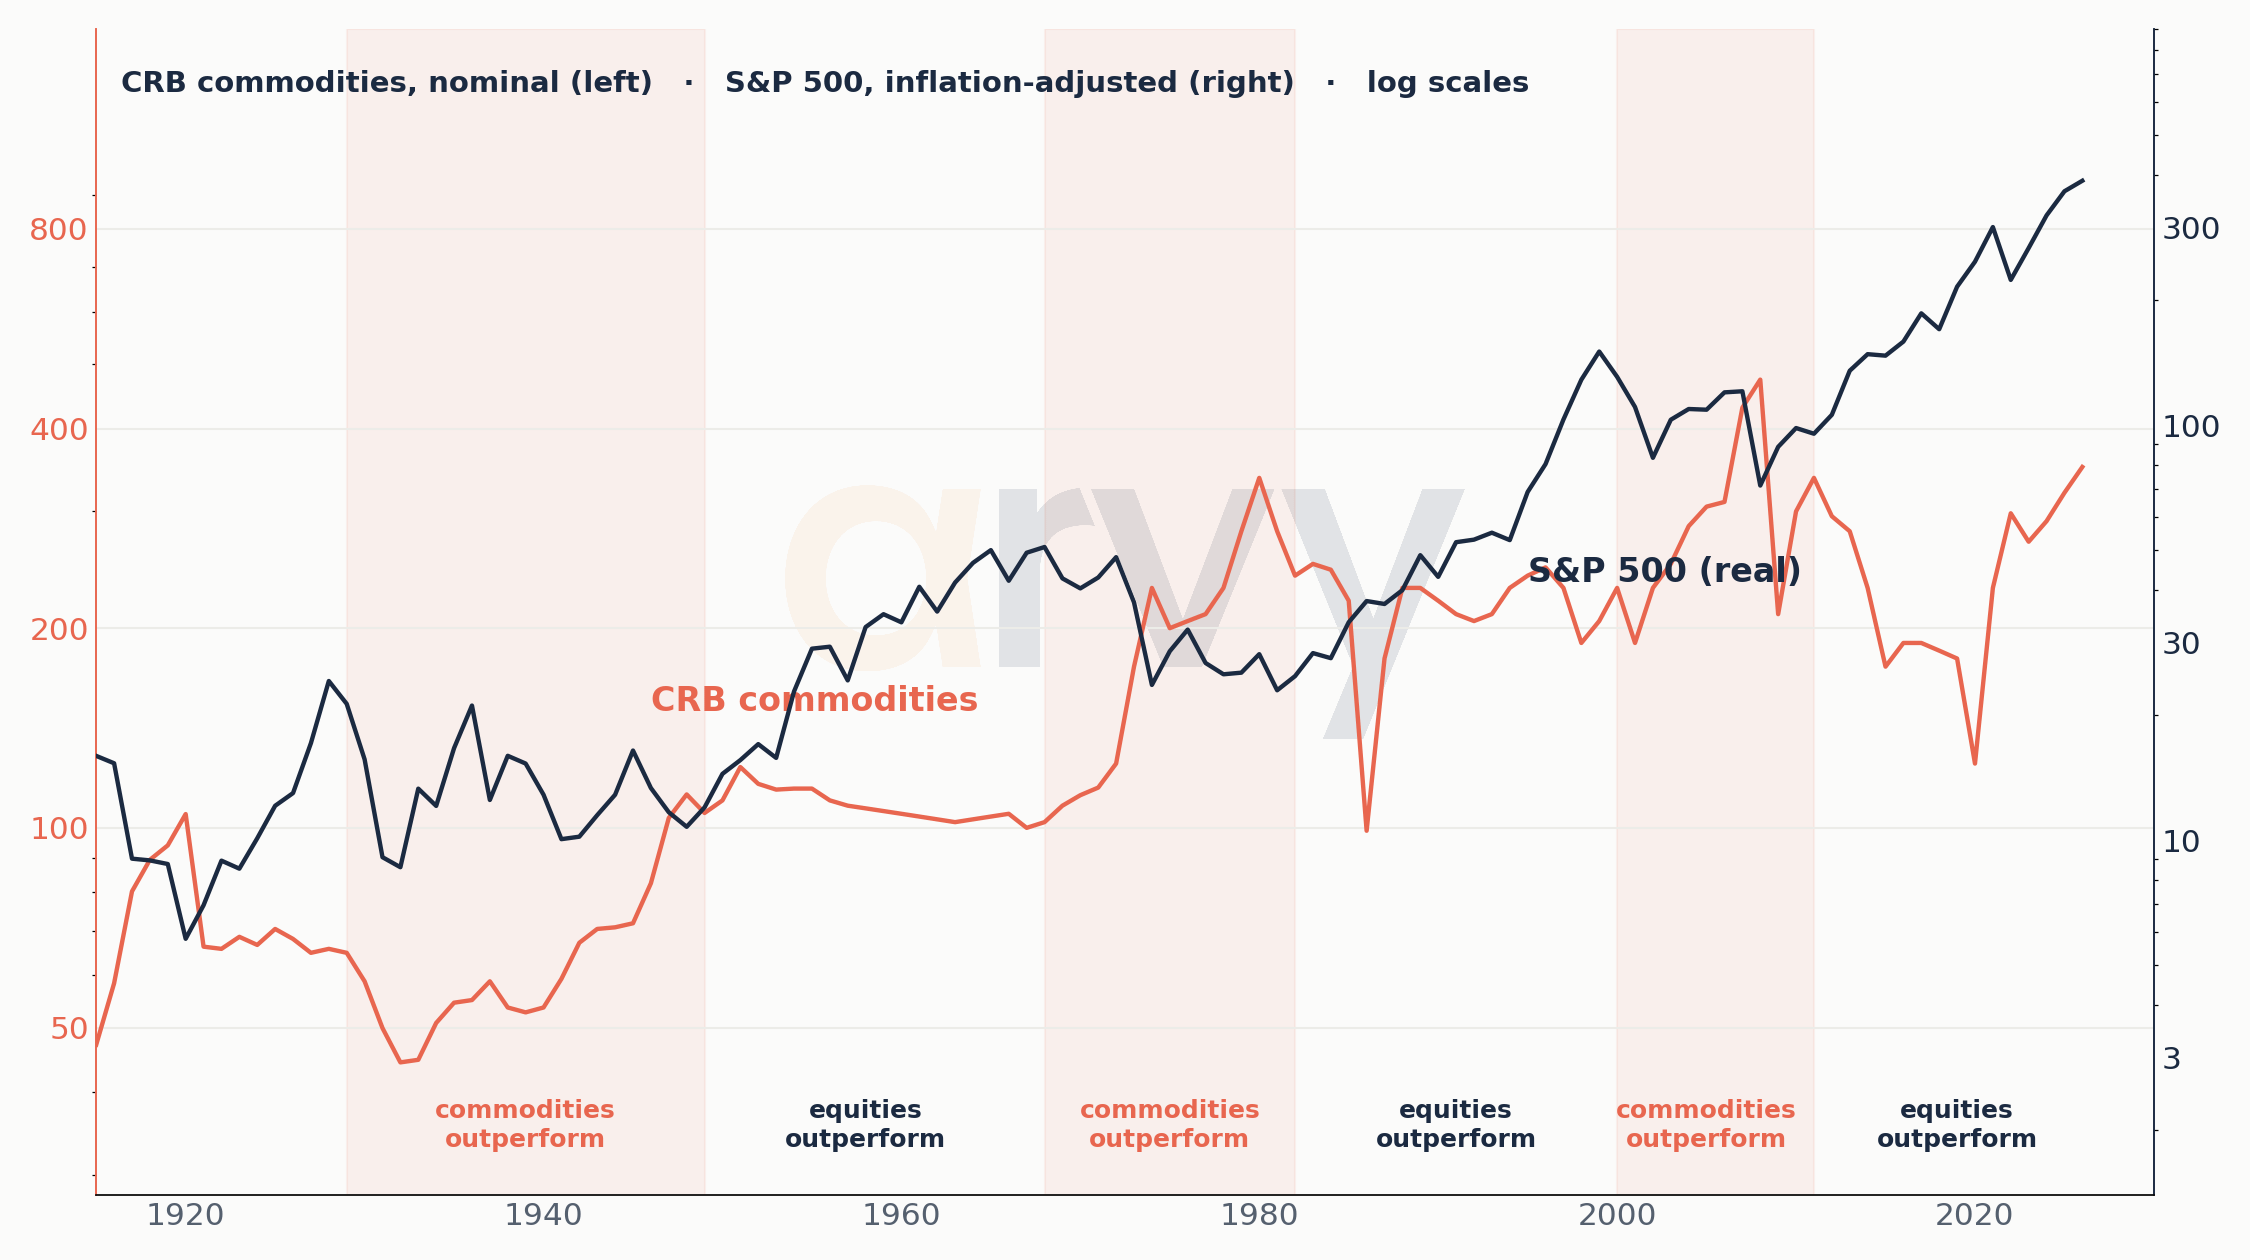
Source: S&P Global, CRB, GMCP · arvy recreation. Regime lines are stylised secular trends.
Chart 4c: Equities and commodities take turns, S&P 500 nominal, since 1800
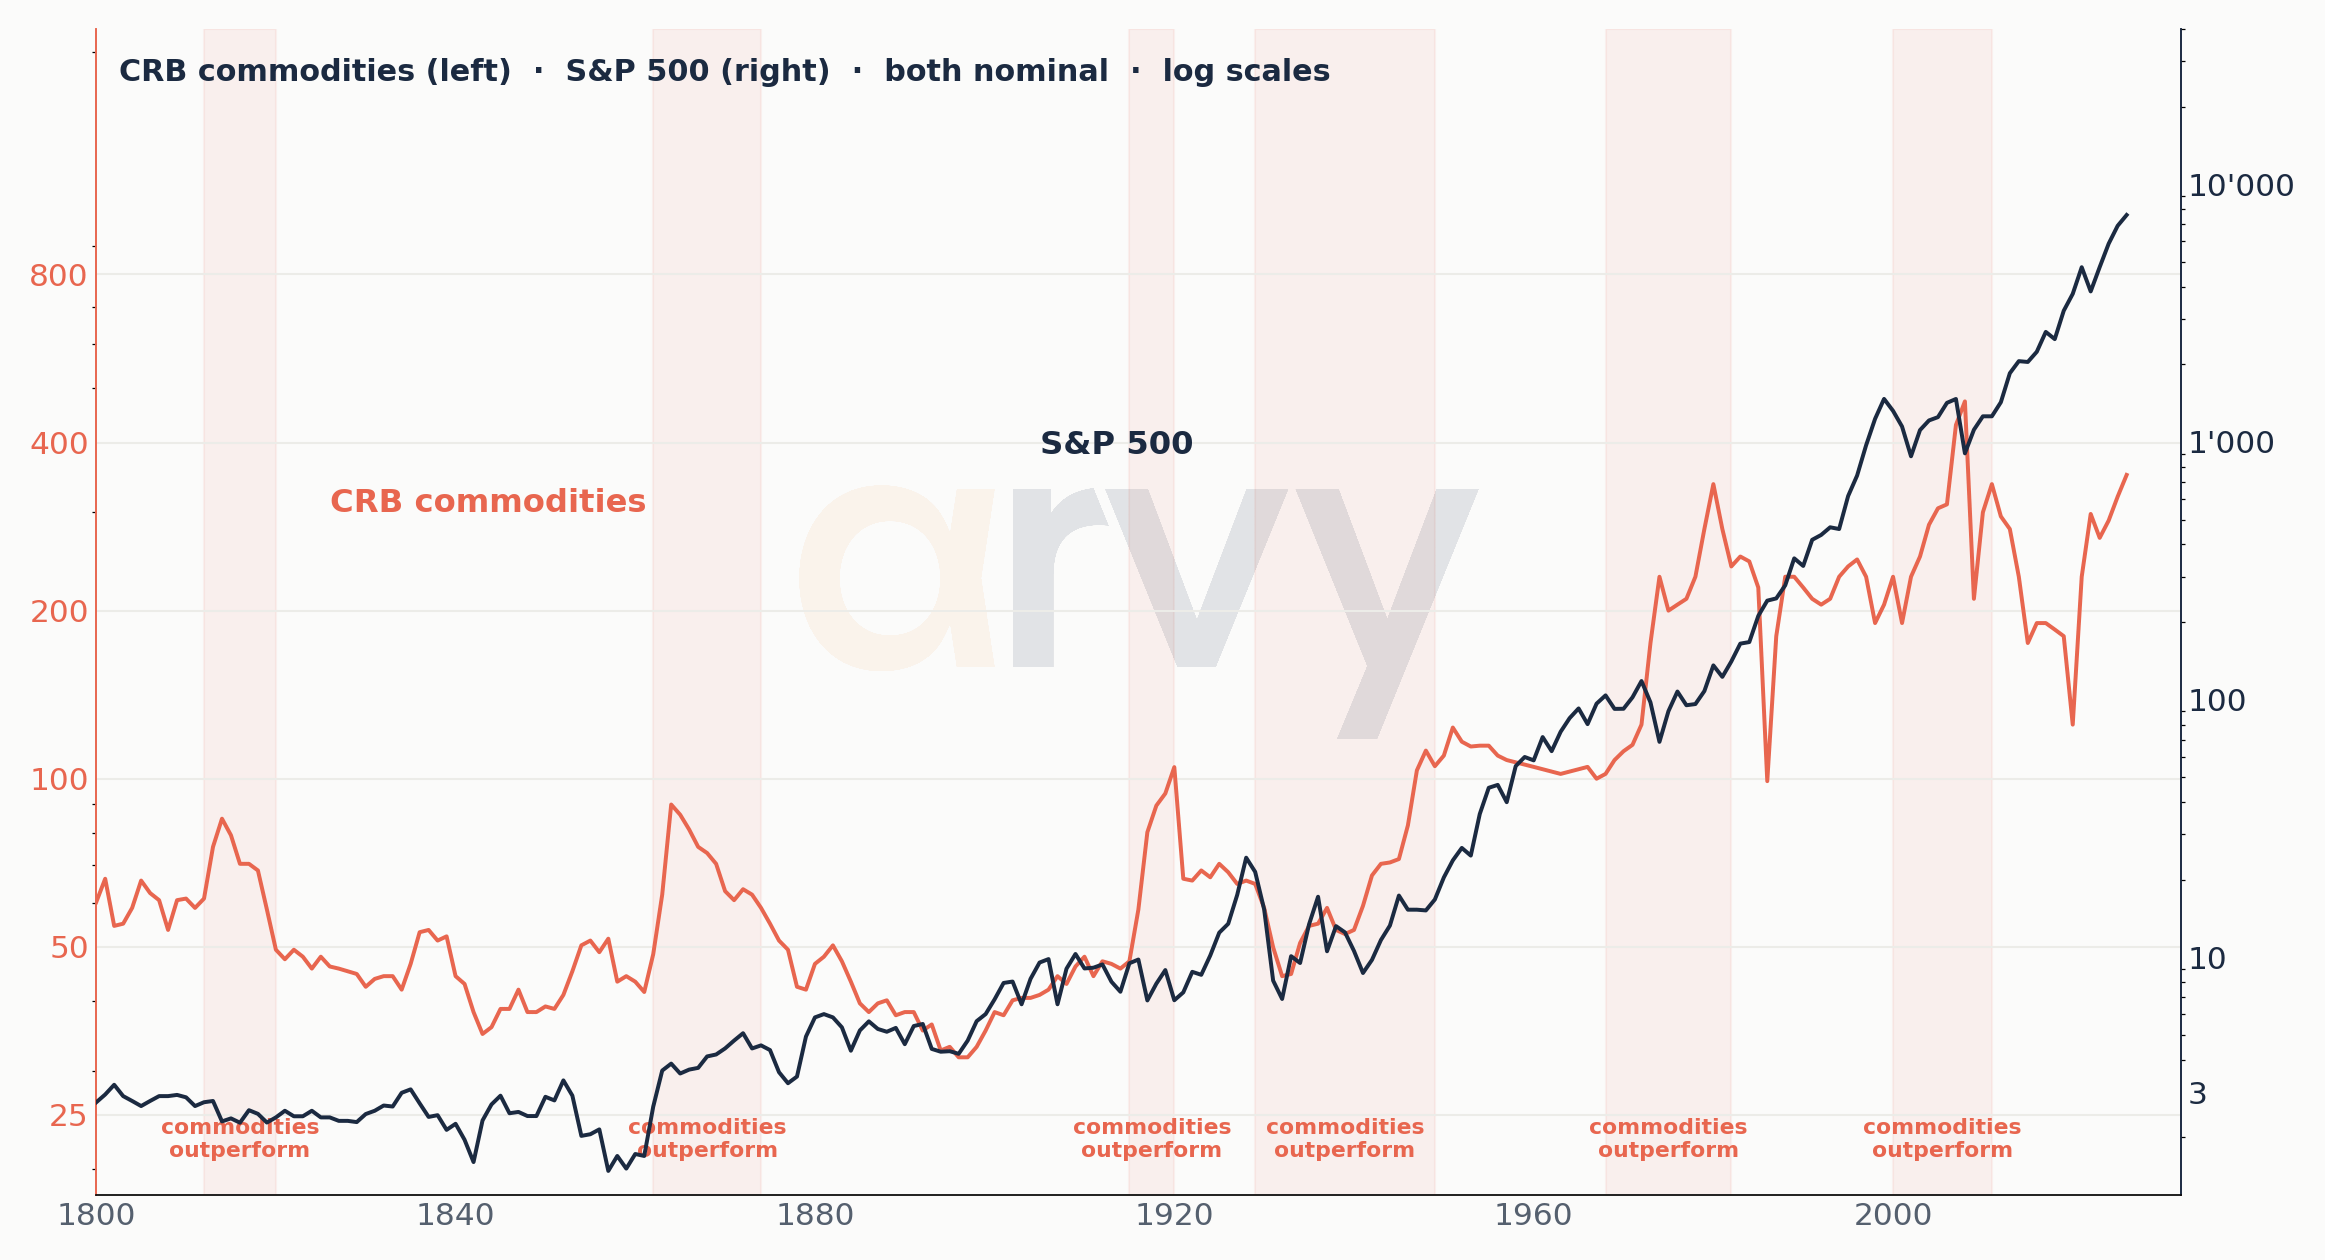
Source: S&P Global, CRB, GMCP · arvy recreation. Regime lines are stylised secular trends.
Chart 4d: Equities and commodities take turns, S&P 500 real, since 1800
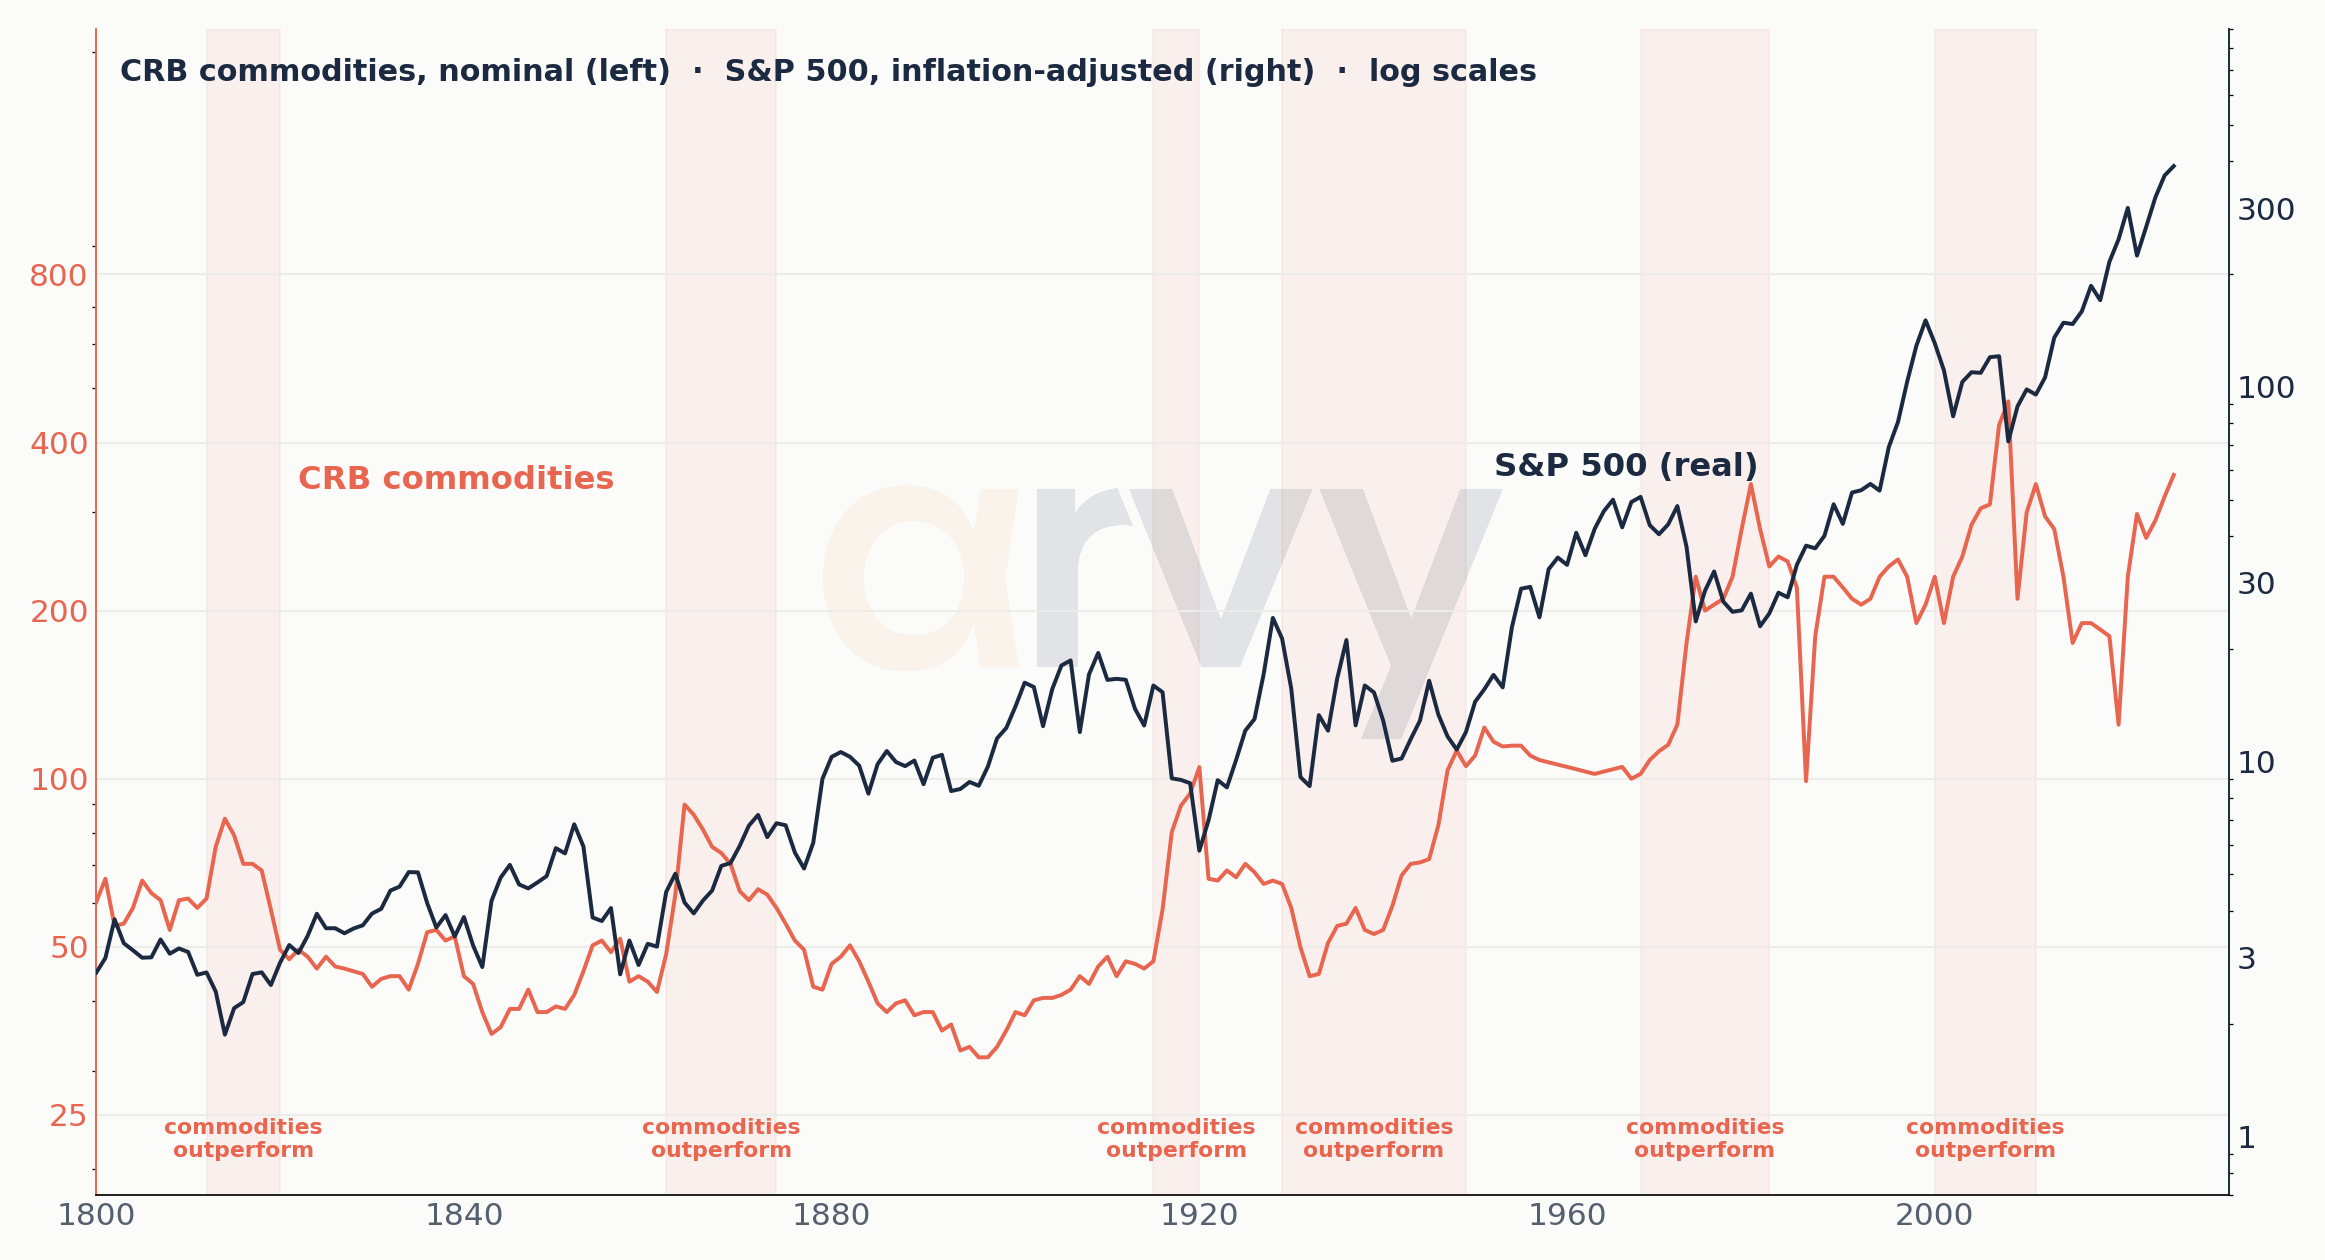
Source: S&P Global, CRB, GMCP · arvy recreation. Regime lines are stylised secular trends.
The point is not a mechanical rotation rule. It is that different inflation, scarcity and capital-cost regimes reward different parts of the market.
Your broker measures dollars. Life measures things.
Inflation has one particularly cruel trick: it can make investors feel richer while making them poorer.
A brokerage statement is nominal. Life is real.
Food. Housing. Energy. Healthcare. Holidays.
That distinction becomes brutal in inflationary regimes.
Chart 5: The nominal-return illusion during inflationary regimes
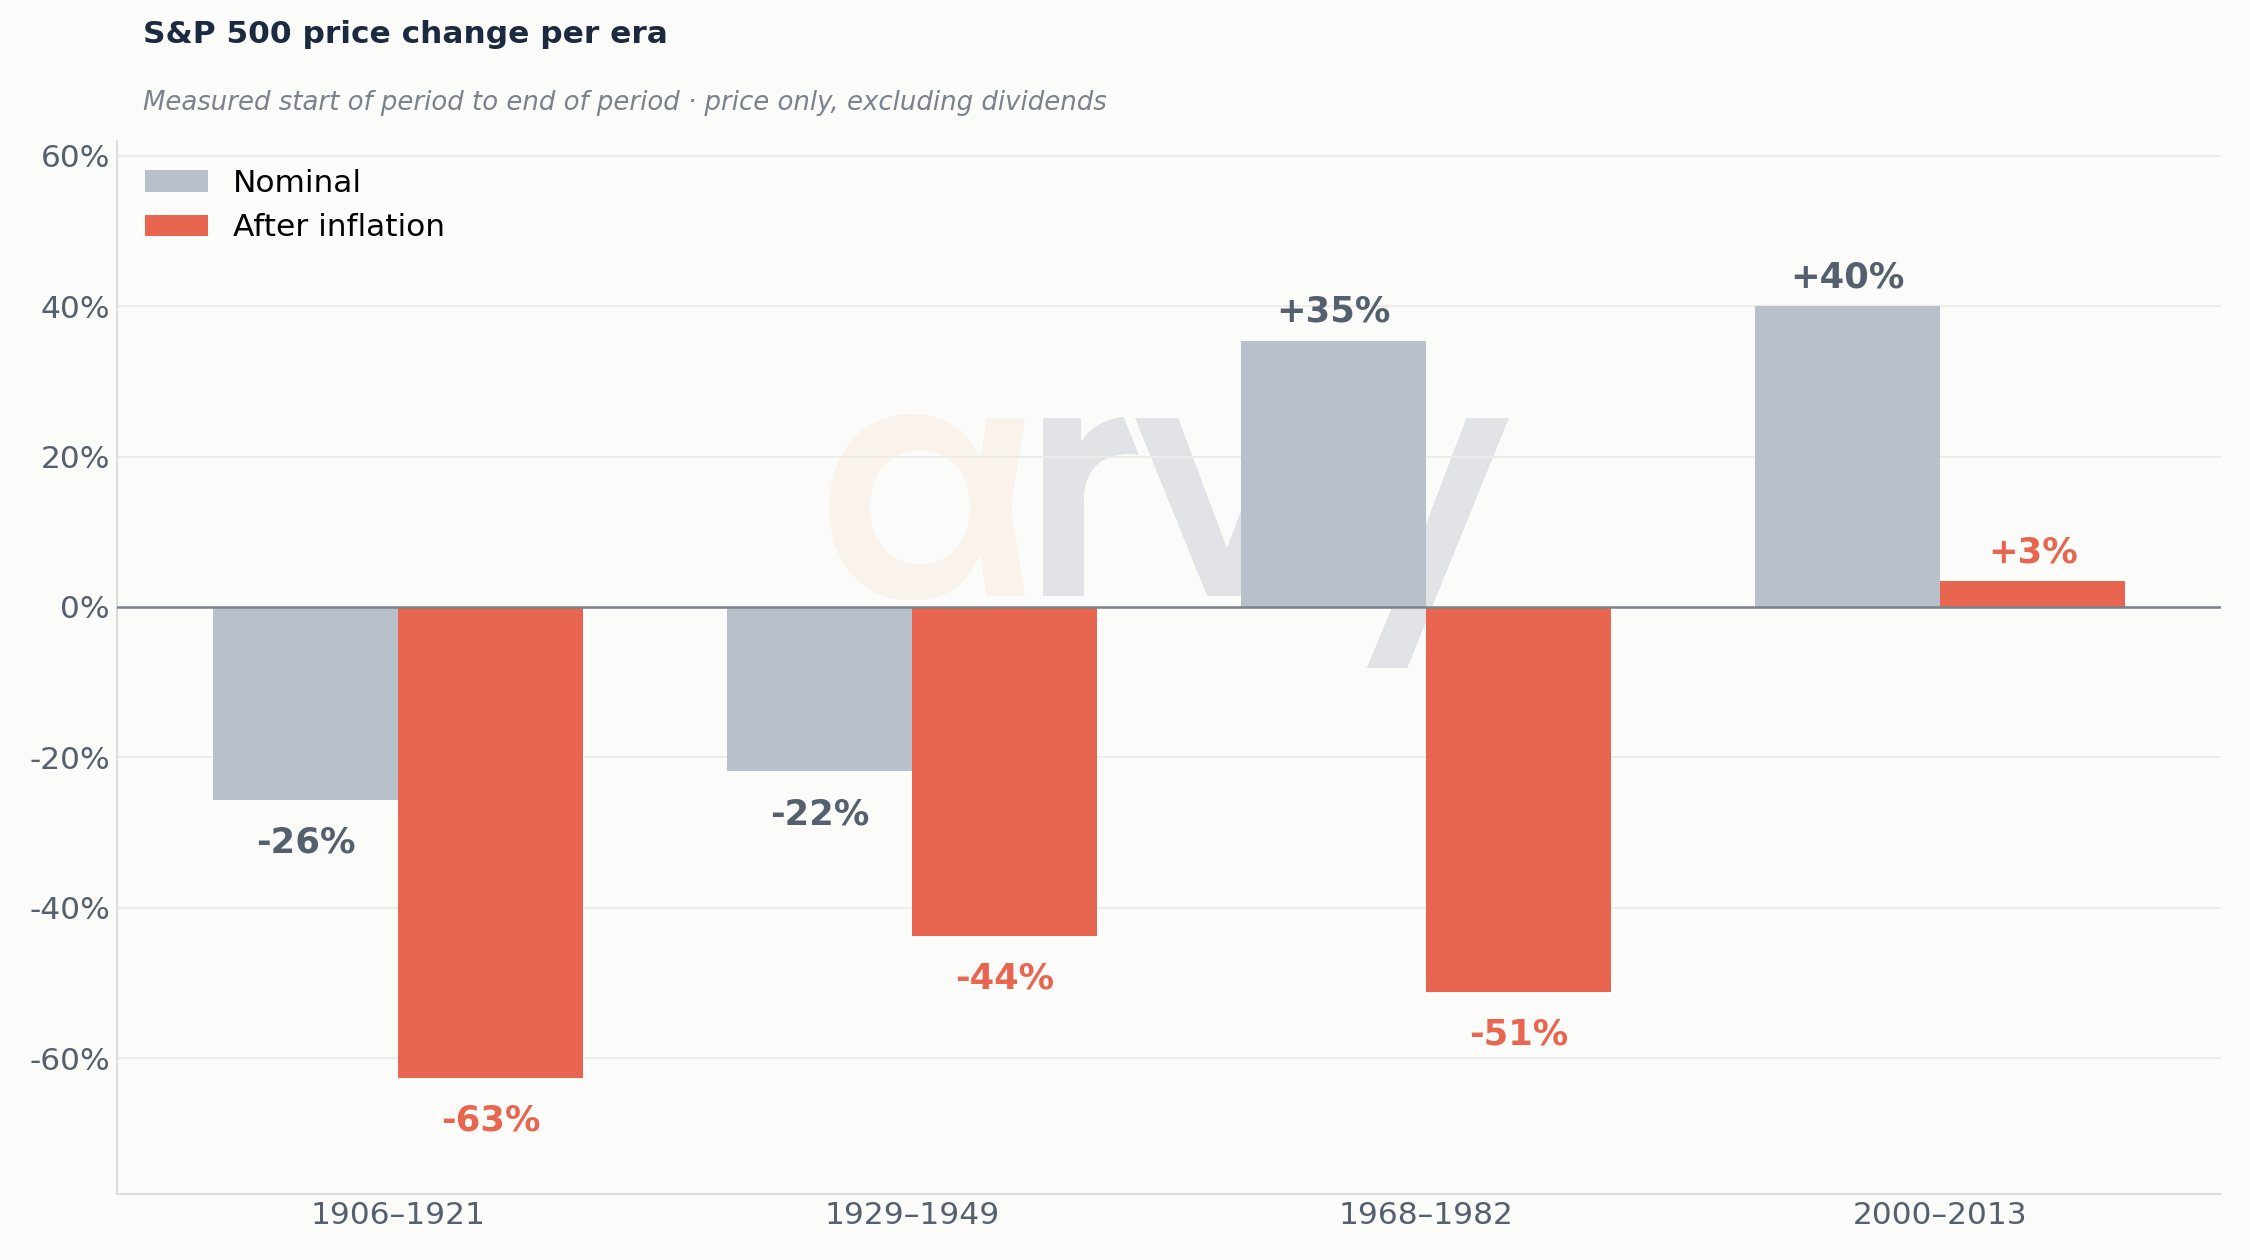
Source: Shiller, FRED · arvy calculations. Real = nominal deflated by cumulative CPI; price only, excluding dividends.
Selected periods: 1915–1920 -26% nominal vs. -63% real; 1941–1948 -22% vs. -44%; 1968–1982 +35% vs. -51%. Real-return calculations are highly sensitive to start/end dates and inflation methodology; use as regime illustrations, not forecasts.
The lesson is simple enough to fit on a napkin: a market can rise in points while your purchasing power falls.
The 1970s did not merely punish bondholders. They changed which businesses, assets and balance sheets mattered.
Every generation gets its own bull market
This is where history becomes almost funny.
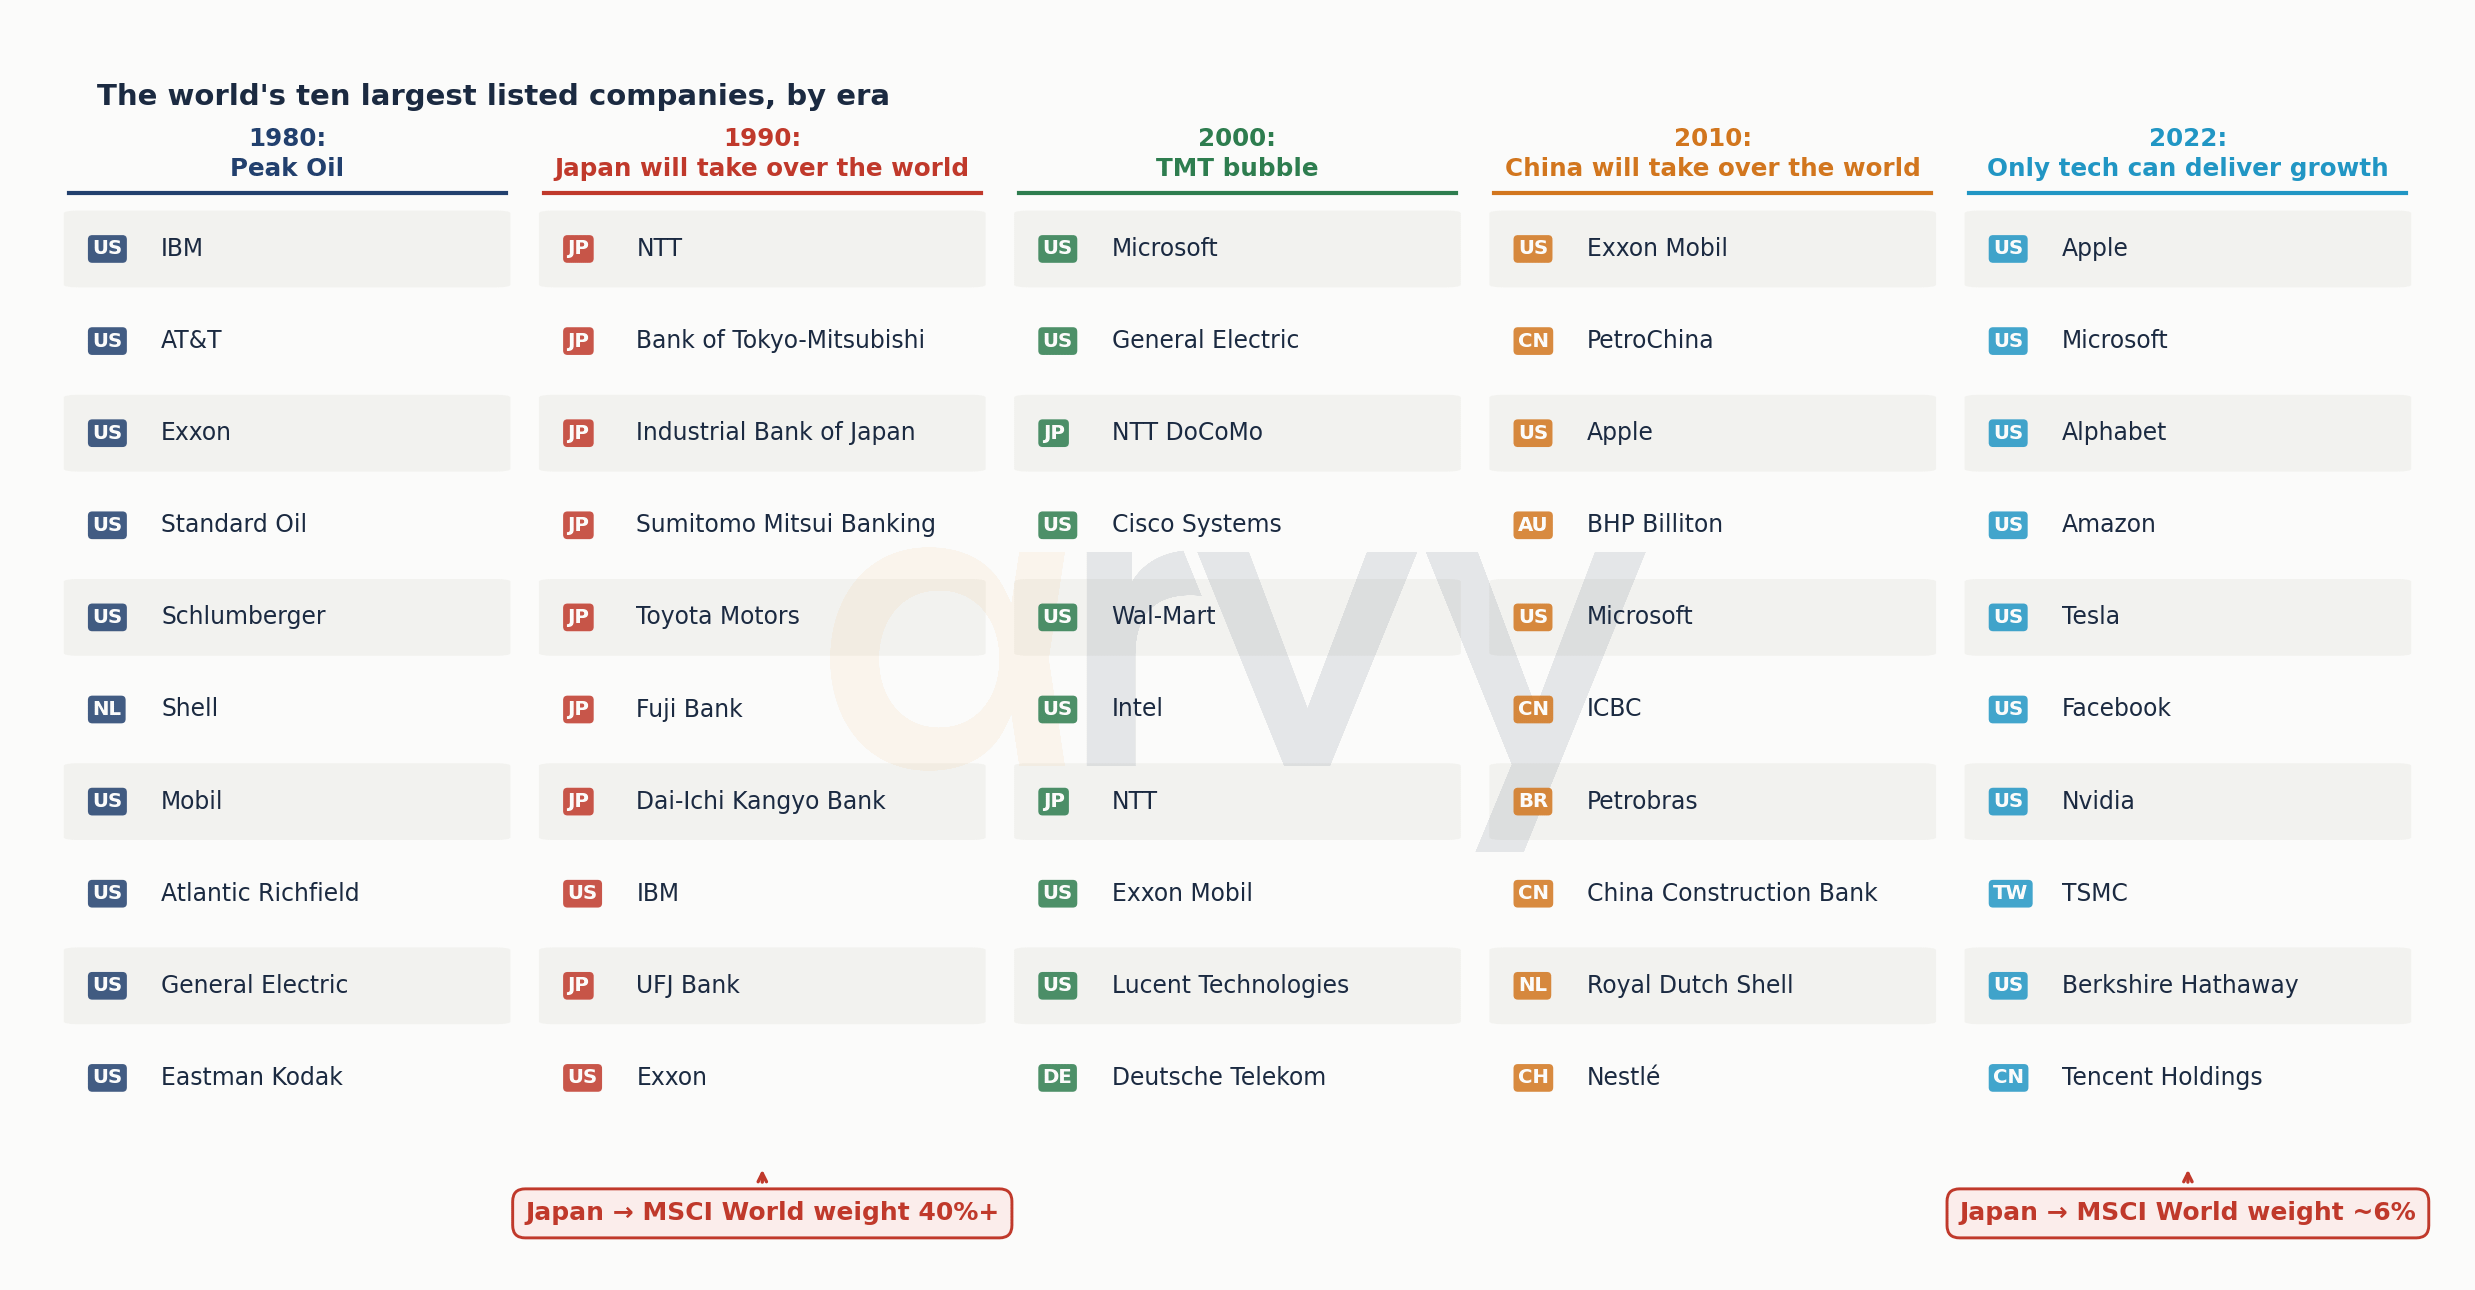
Look at the world’s largest companies at different points in time.
Chart 6: The world’s largest companies change with the regime
Source: Gavekal Research. Largest listed companies by decade
1980: oil. 1990: Japan. 2000: TMT. 2010: China and commodities. 2022: mega-cap technology. The names change. The confidence does not.
In 1980, energy dominated. Of course it did. Investors had just lived through oil shocks and inflation.
By 1990, Japan looked unstoppable. NTT, Japanese banks, Toyota. Japan became an enormous share of the global index. Buying “the world” meant buying a lot of Japan — not because somebody in Geneva had decided Japanese stocks were cheap, but because they had already gone up.
Then came 2000. Microsoft. Cisco. Intel. Telecom. The internet would change the world.
It did.
The problem was not necessarily the story. The problem was the price.
Then China. Then commodities. Today: Apple, Microsoft, Alphabet, Amazon, Nvidia, TSMC.
The dangerous sentence is not “this is a great business”.
It is “this leadership is permanent”.
Concentration is not the problem. Permanence is.
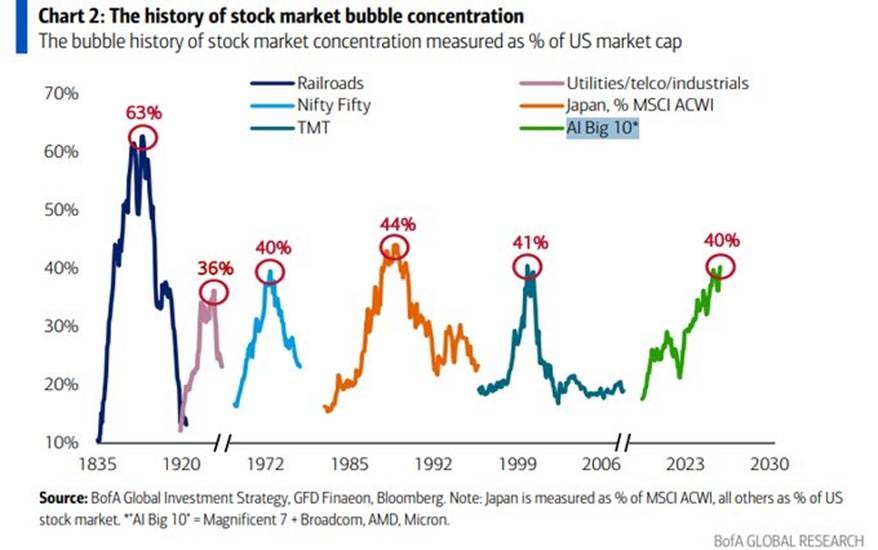
Chart 7: The history of stock-market concentration
Source: BofA Global Investment Strategy, GFD Finaeon, Bloomberg.
Railroads, utilities/telecoms/industrials, the Nifty Fifty, Japan, TMT and today’s AI leaders each reached striking concentration. Concentration can be rational. Permanence is the dangerous assumption.
Calling today’s market “1999 again” because a concentration chart rhymes is lazy. Today’s technology giants produce extraordinary revenues, profits and free cash flow. They are not Pets.com with better typography.
The better question is harder: what assumptions about the future are embedded in today’s market weights?
Railroads represented industrialisation. Oil represented scarcity. Japan represented export and manufacturing dominance. TMT represented digitisation. China represented globalisation and fixed investment. Mega-cap technology represents software, cloud, network effects and now AI.
Every great concentration is partly the economics of its regime written into an index.
Which leads to a slightly uncomfortable question: what will investors in 2050 find amusing about the portfolios we consider completely obvious today?
The template: when a great business and a great stock part company
Rollins is a live case, and live cases are always arguable. So take one where the outcome is already known.
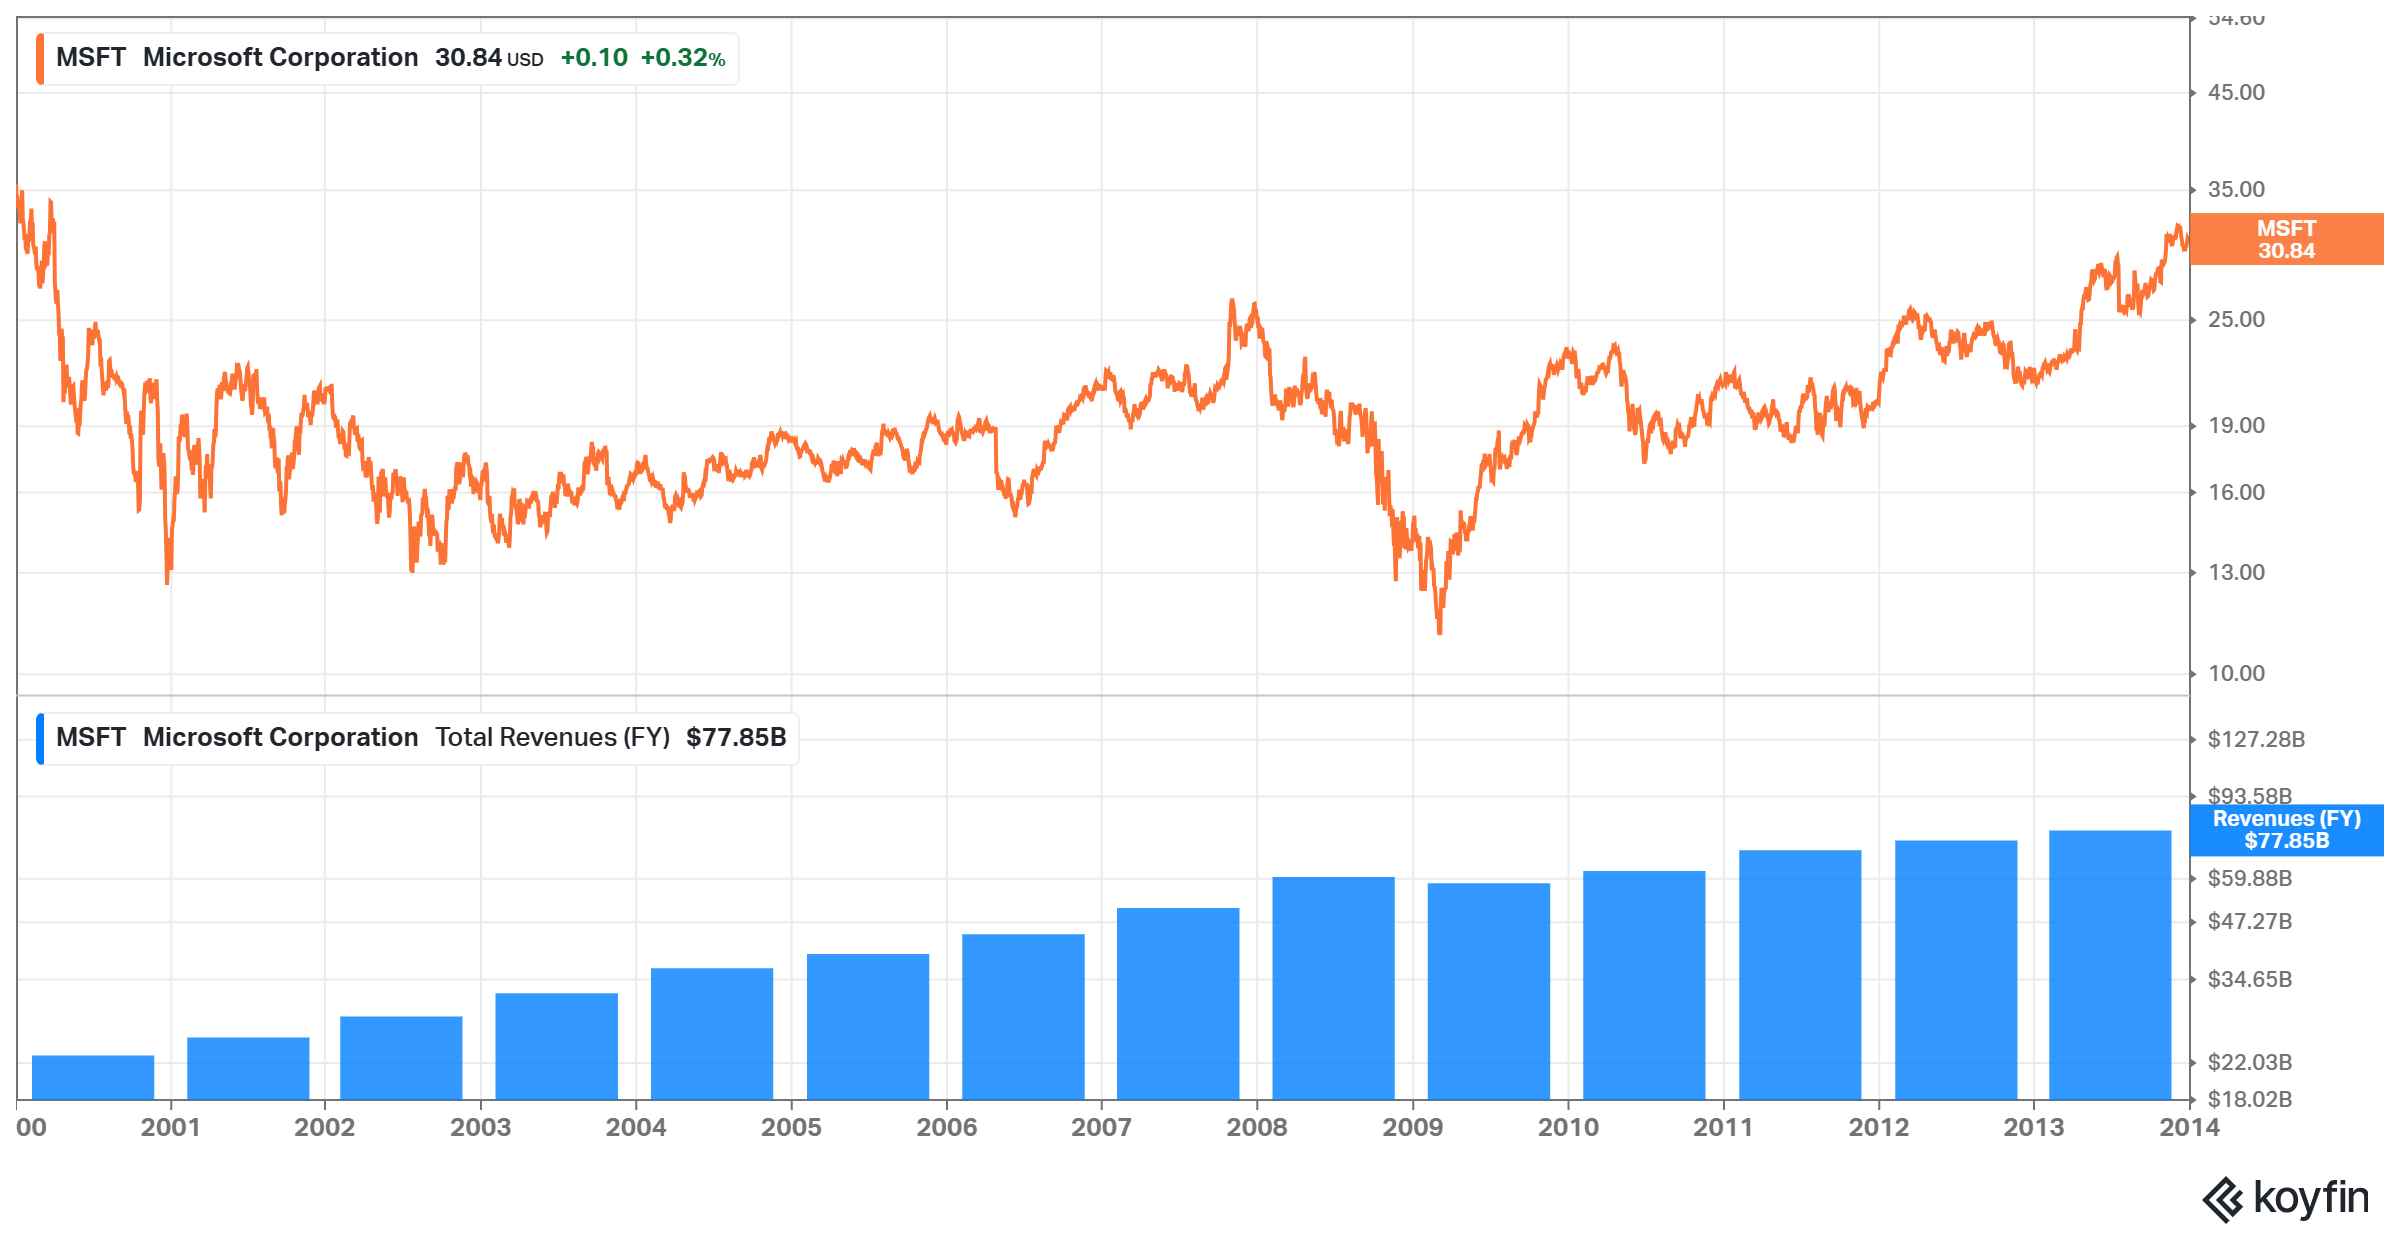
Microsoft in December 1999 was not a bad business. Over the following fourteen years it roughly quadrupled its revenue, stayed dominant in operating systems and office software, generated enormous cash and paid a growing dividend. Almost everything the bulls said about the company turned out to be right.
The stock went nowhere for fourteen years.
Not because the business failed, but because the price already contained the future. An investor who bought the best software franchise on earth at the end of 1999 waited until 2014 to get back to even in nominal terms — considerably longer in real terms. Being right about the company and right about the price are two different problems, and only one of them was solved in 1999.
That is the pattern worth carrying out of this essay. Not that quality stops working. That quality bought at a price set by a different discount rate can take a very long time to pay you back — and the interval feels, day to day, like nothing dramatic is happening at all.
Chart: Microsoft 2000–2014 — the business quadrupled, the stock went nowhere
Source: Koyfin. Price return excludes dividends.
The strategy built inside the regime
For most investors today, passive investing feels timeless.
It is not.
Indexing is an excellent invention. Cheap, transparent, tax-efficient and brutally difficult for expensive mediocre active managers to beat. Do it.
But its rise to cultural dominance happened inside a very specific market environment.
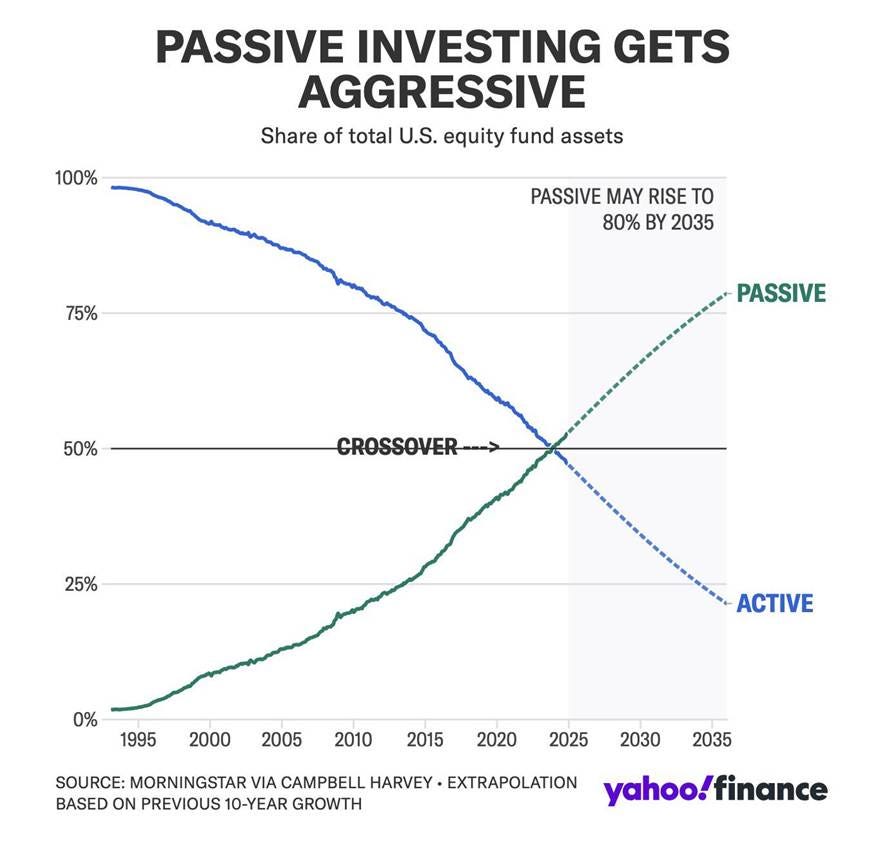
Chart 8: Passive investing goes from fringe to majority
Source: Morningstar via Campbell Harvey, Yahoo Finance. 2035 values are an extrapolation, not a forecast.
The projection to 2035 is an extrapolation, not a forecast. The historical crossover is the useful point: passive became dominant after a multi-decade expansion that overlapped the long decline in yields.
From the early 1980s to 2020, yields fell for almost four decades. Over the same broad era, indexing moved from the fringe of finance to its centre.
That does not prove falling rates caused passive investing to win. It would be bad history and worse statistics to claim that.
But it raises a worthwhile question: passive won because it is cheap, transparent and hard to beat. How much easier was that victory to trust because it came of age during a regime that rewarded broad ownership so generously?
The secular decline in discount rates was friendly to broad ownership. Asset prices rose. The biggest winners became larger index weights. Strong performance attracted flows. Market-cap weighting automatically allocated more of each new passive dollar to what had already become largest.
Passive did not merely succeed during the bond bull market.
It became the default philosophy of investing during it.
Again: ETF bad is not the argument. Passive remains the right answer for millions of investors.
The argument is subtler. A strategy can be structurally excellent and still be shaped by the regime in which investors learned to trust it.
If the price of time remains higher, dispersion may matter more. Some companies will fund themselves. Others will discover cheap capital was doing more work than anyone realised.
For long stretches, the tide did enough work that owning the whole ocean looked wiser than inspecting every boat.
If the tide weakens, seaworthiness matters again.
The cockroaches did not disappear
Consider Rollins.
It kills cockroaches. Termites. Ants. Mosquitoes.
Pest control is not an industry famous for technological disruption. No AI model in San Francisco has yet taught termites to negotiate a peace treaty with homeowners.
Chart 9: Rollins: a great business can still suffer a brutal drawdown
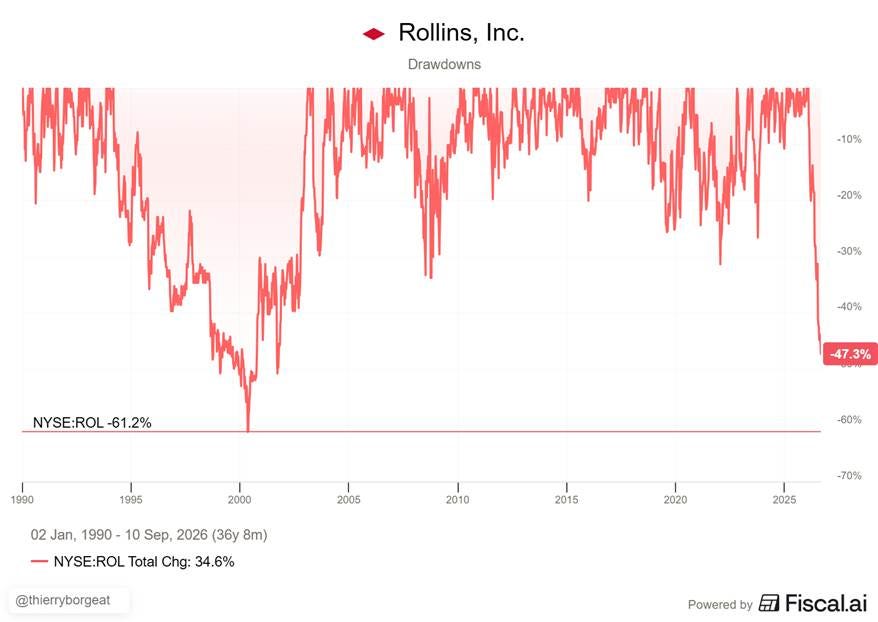
Source: Fiscal.ai, NYSE: ROL, 2 Jan 1990 – 10 Sep 2026. Drawdown from peak.
The chart shows a current drawdown of roughly -47.3% and a historical maximum drawdown around -61.2%. Note that not even during the Global Financial Crisis Rollins had such a sharp bear market. Drawdown alone does not establish causality; it illustrates how valuation can move violently even when the underlying service remains essential.
The cockroaches did not disappear.
The price investors were willing to pay did.
And this is where higher rates become painfully concrete for serial acquirers.
A target expected to return 7% looks wonderful when debt costs 2%. At 5%, less wonderful. Raise the discount rate and the target’s future cash flows are worth less today. Compress the acquirer’s own multiple and its equity becomes a weaker acquisition currency. Slow organic growth at the same time and investors become less willing to pay a heroic multiple for acquired growth.
This is not an accusation that Rollins is a debt-fuelled roll-up. It is the opposite: the company is useful precisely because even high-quality acquisition models operate under a hurdle rate.
The same growth deserves a different valuation when the price of money changes.
Higher rates do not merely make capital more expensive.
They make mistakes more expensive.
Maybe inflation changed too
Chart 10: US CPI and the possibility of a higher inflation regime
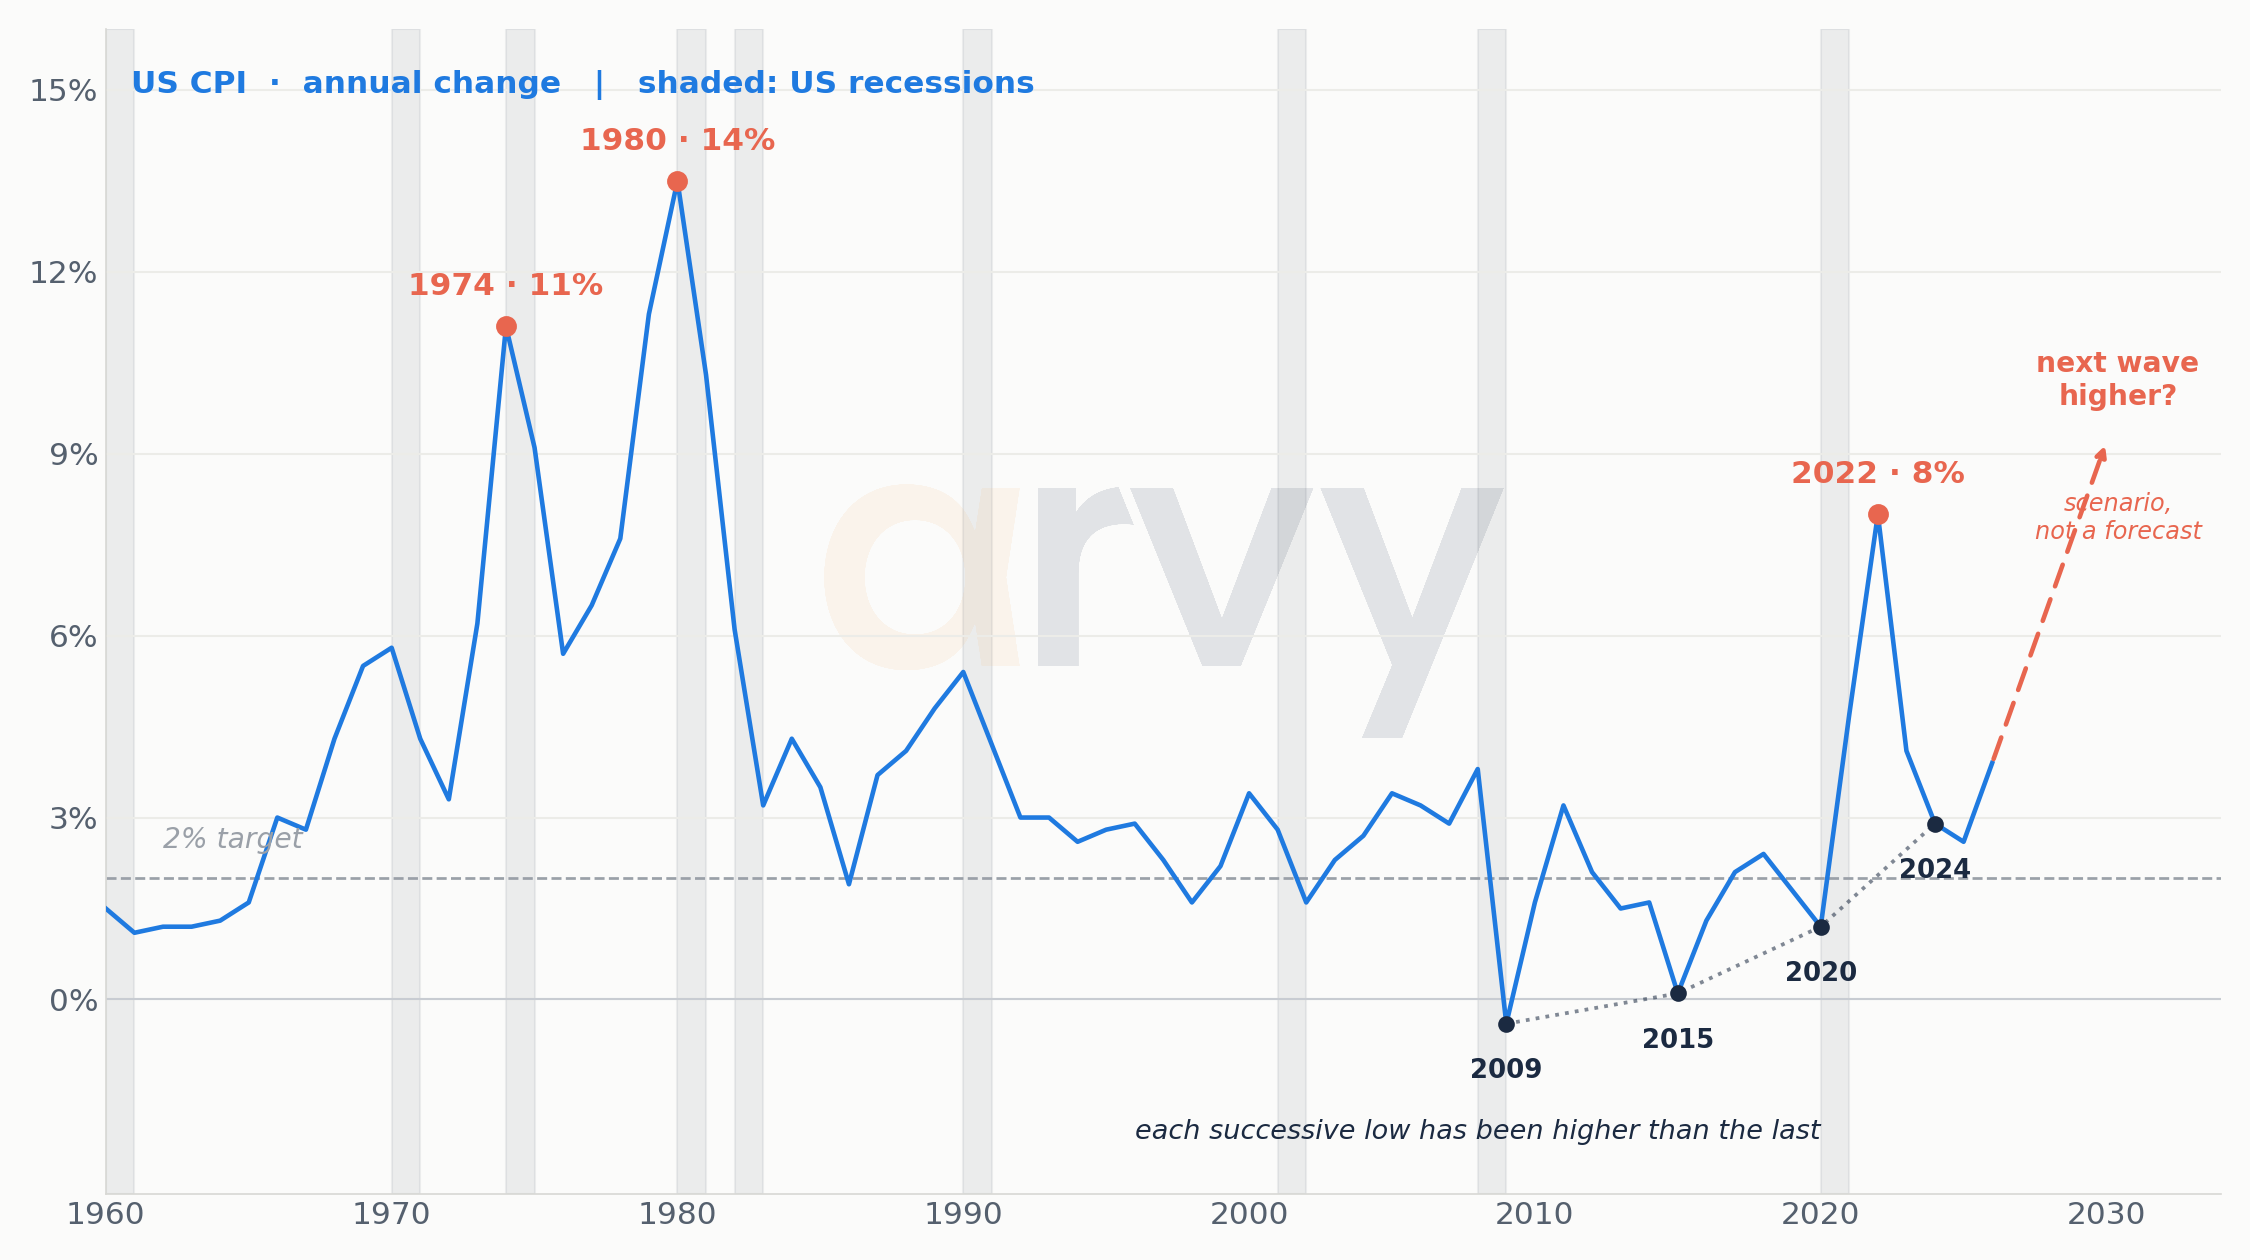
Source: FRED · arvy. Annual US CPI change, shown as history, not a forecast.
The forward arrows are a scenario, not evidence. The historical CPI series is the evidence; the future path is unknown.
The post-2020 inflation shock may fade into history as a temporary accident. Or it may have been the opening chapter of a different regime.
Globalisation is no longer advancing without resistance. Supply-chain resilience competes with pure efficiency. Defence spending is back. Energy security matters. Grids, data centres and AI require physical capital. Governments carry more debt. Industrial policy has returned to polite conversation.
None of that guarantees structurally higher inflation.
It simply makes a repeat of the 2010s less automatic than markets once assumed.
Use this as a provocation, not prophecy. The projections for 2028/2039 and the cycle lengths are observations and historical parallels, not predictions.
Turn every arrow around
The easiest way to understand the potential regime change is to reverse the arrows investors grew accustomed to.
1981–2020 Rates ↓ → financing costs ↓ → discount rates ↓ → valuations ↑ → leverage easier → distant growth more valuable
2020–? Rates ↑ → financing costs ↑ → hurdle rates ↑ → valuation discipline returns → balance sheets matter → cash flow today matters
That does not mean everything falls.
It means the distance between good and bad capital allocation can become wider.
And dispersion is where active investors earn their keep.
Why a harder market could be a better market
This is the part that may surprise you.
I am not pessimistic.
I am excited.
If the secular tailwind weakens, differences between businesses matter more.
One company funds growth from internal cash flow. Another needs the bond market. One has pricing power. Another merely enjoyed cheap inputs. One earns high returns on invested capital. Another looked profitable because capital was artificially cheap. One trades at a price that assumes perfection. Another compounds quietly away from the spotlight.
This is not the death of passive investing. It is not a forecast that the S&P 500 goes nowhere for ten years. And it is certainly not a prediction that the 10-year Treasury is heading straight back to 15%.
It is a simpler claim: when the tide does less work, the swimmer matters more.
What we want to own when time has a price
We do not know where the 10-year Treasury will trade in 2030.
Fortunately, we do not need to.
We want businesses that do not require free money to work. Businesses that generate their own cash rather than raising it. That earn high returns on the capital they employ. That carry balance sheets which do not depend on the refinancing window staying open. That possess genuine pricing power — the ability to raise prices without losing the customer, which is the only real defence in an inflationary world. And that are run by people who understand that capital has a cost.
And then comes the unfashionable part.
We want to pay a sensible price for them.
None of that is new. It is what investing looked like before the discount rate did the work for everybody. The last four decades made it optional. The next ones may not.
For us at arvy, this is where macro becomes micro again.
We do not want to build a portfolio around a heroic forecast for Treasury yields. We would rather ask questions that matter across several possible futures.
Can management allocate capital intelligently when capital actually has a cost?
Does it earn attractive returns on invested capital?
Does the company generate real free cash flow?
Can it finance growth internally?
Does it have pricing power?
Is the balance sheet robust?
What are we paying for it?
A wonderful company can be a terrible investment at the wrong price.
A changing discount rate has a wonderful habit of reminding everyone.
And what if we are wrong?
Easy.
Inflation drifts quietly back to 2% and stays there. Real yields sink toward zero again. Dispersion disappears, and the largest companies simply grow into today’s valuations.
Then the old regime was not dead. It merely took a Covid holiday.
Possible. Investing would be a great deal easier if history arrived with labels.
Every generation learns the wrong lesson
Someone beginning an investment career in 1975 learned that inflation was permanent.
Someone starting in Tokyo in 1985 learned that Japan was destined to dominate the world.
Someone entering markets in 1998 learned that technology could only go up.
Someone starting in 2005 learned that Chinese commodity demand was inexhaustible.
Someone starting after 2009 learned that every problem would eventually be answered with lower rates.
Someone starting today may conclude that American mega-cap technology is the only game in town.
Some of these ideas were correct.
For a while.
That is what makes regimes so seductive. They do not begin as delusions. They begin as truths.
Then the truth becomes consensus. The consensus becomes positioning. And eventually the world changes.
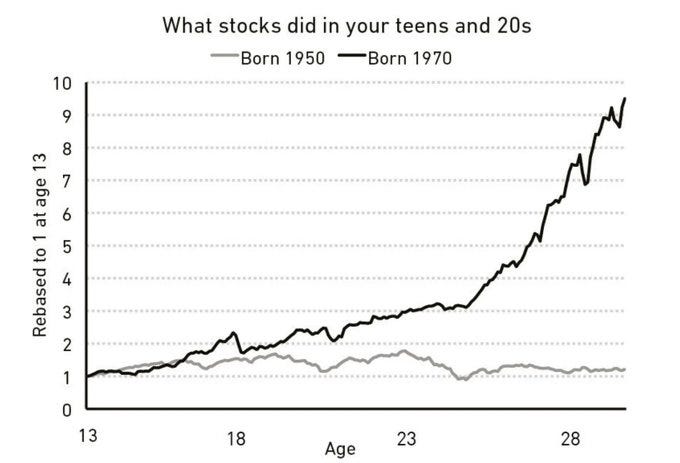
And here is one final thought experiment for you.
Imagine two investors.
One comes of age during a period in which stocks compound spectacularly (10x). The other comes of age during a period in which inflation eats away at years of nominal gains.
They are looking at the same asset class.
They may spend the rest of their lives believing completely different things about it.
That is the uncomfortable part.
We do not form our beliefs about money from two hundred years of history. We form them from the tiny piece of history we happened to live through.
Perhaps the most useful investment question is therefore not: “What happens next?”
But…
Which of the things I currently believe are simply products of the world I happened to grow up investing in?
That is a harder question.
Probably a more useful one, too.
Heraclitus was right.
The river changes. Markets change. The winners change. The price of money changes.
The only dangerous assumption is that they will not.
For 39 years, investors sailed with the wind at their backs.
Now we may finally find out who can sail.
Love,
Thierry and team arvy
This is Part 1 of the Trilogy.
──────────────────────────────────────────────────────
Source & editorial notes
Historical-yield caveat: there is no single official continuous 10-year US Treasury series back to 1800. Modern constant-maturity data begin in the 1950s; earlier observations rely on reconstructed government-bond yields and proxies. Early history is therefore used to discuss broad regimes, not instrument-level precision.
Real-return caveat: real figures are nominal price indices deflated by cumulative CPI, excluding dividends. Different reconstructions produce materially different nominal figures for the same windows; the series and method used here are stated above.
Legal Notice: At the time of publication, the companies mentioned may or may not be portfolio holdings of arvy. This document has been prepared solely for informational and marketing purposes and does not constitute an invitation, offer, or recommendation to acquire or sell any financial instruments.
Thank you very much for this excellent, thought-provoking post, Thierry. It’s a topic that hasn’t been discussed nearly enough so far, but one that has enormous implications worldwide.
The bond “bubble” framing is useful, but the real issue isn’t that bonds were expensive.
It’s that an entire financial system was built around permanently falling discount rates.
For 40 years:
yields ↓ → bond prices ↑ → equity multiples ↑ → real estate ↑ → leverage ↑
Now reverse the sign:
yields ↑ → duration loses value → refinancing gets harder → fiscal costs rise → every long-duration asset gets repriced
That is why the bond market matters more than whatever bubble is trending on social media.
The real mother of all bubbles was never just bonds.
It was the belief that the discount rate would keep falling forever.