

Terry Smith Capitulates: Quality Needs Momentum — Fortinet Proves It, AppLovin Tests It
For fifteen years, Fundsmith’s mantra was «Buy good companies. Don’t overpay. Do nothing.» On the first of July 2026, the third leg broke.

For fifteen years, Fundsmith’s mantra was «Buy good companies. Don’t overpay. Do nothing.» On the first of July 2026, the third leg broke. Terry Smith told his investors that he will now take momentum into account — and started buying names like AppLovin. At arvy, we have been running a dual lens on quality and momentum from day one. Here is what it shows in the most contested corner of the market: software.
«In order to finish first, you must first finish.»
Motor racing maxim from the Indianapolis 500 — quoted by Terry Smith, July 2026
It happened.
On the first of July, a letter landed from London.
Not just any letter. The semi-annual letter of Fundsmith Equity Fund — the fund of Terry Smith, the man the press likes to call the English Warren Buffett. The investor who built a career, a fortune, and a fifteen-year track record on three deceptively simple commandments: buy good companies, don’t overpay, do nothing.
The first two commandments survived the letter.
The third one didn’t.
Somewhere between the performance table (Fundsmith down 2.9% in the first half, a full 14.1 percentage points behind the MSCI World) and the appendix, Terry Smith wrote a sentence that would have been unthinkable in any of his previous letters:
«We will take more account of momentum — both fundamental and share price.»
Read that again.
The high priest of quality investing — the man who spent a decade and a half teaching the world that share prices are noise and fundamentals are signal — just told his shareholders that he will now listen to the tape.
Some will call it capitulation. Some will call it adaptation. We call it something else entirely:
Overdue.
Because what Terry Smith described in that letter — the pain of sitting on fundamentally sound businesses that the market simply refuses to honor — is precisely the problem our Good Story & Good Chart® framework was built to solve. And nowhere is that problem more brutal right now than in software.
So today, let’s do three things. First, understand what actually happened in London. Second, look at the software battlefield — the sector where great businesses go to get sold off anyway. And third, find the two places where fundamentals and Mr. Market’s verdict still line up. There are only two. And funnily enough, Terry Smith just bought his way into the story of a third — we’ll get to that.
The Letter Nobody Saw Coming
Let’s give credit where it’s due: the letter is remarkably honest. Most managers bury a bad half-year in relative-performance yoga. Smith instead spends pages explaining why his approach stopped working — and what he intends to do about it.
And before we go one step further, let me hang a picture on the wall of this article.
The Man in the Arena — Theodore Roosevelt
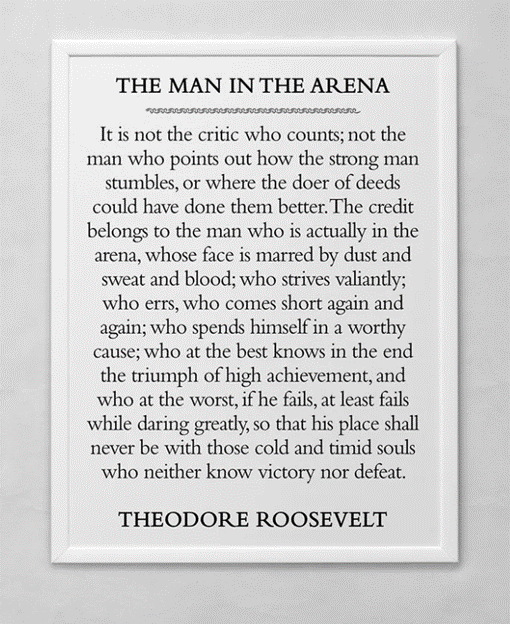
Source: Theodore Roosevelt, «Citizenship in a Republic», Sorbonne, Paris, 1910.
«The credit belongs to the man who is actually in the arena.» Not to the critic. I have been in this arena myself for fifteen years — face marred by enough dust, sweat, and drawdowns to know exactly what it costs to stand in front of your investors and say: my approach must change. That is the hardest sentence in this profession, and Smith wrote it in plain English, with his name underneath.
So you will find no shaming here, no blaming, no laughing. Only the stoic reading: accept what is, honor the honesty, and learn from the journey — his and our own. One man in the arena, tipping his hat to another. Now, to the lessons.
His diagnosis, paraphrased: the market is no longer priced by people who read balance sheets. Passive vehicles now hold more than 60% of fund assets, and — citing Cboe data — active managers’ share of actual trading volume has collapsed from roughly 80% in the 1990s to about 10% today. The marginal price-setter is no longer an analyst with a DCF model. It is a flow. A rebalancing. A feedback loop in which money leaves underperforming active funds, pours into index trackers, pushes up whatever is already big and already rising, and thereby makes active funds underperform even more.
He points to a Bloomberg chart showing momentum as a factor at a thirty-year high — more extreme than late 1999. He describes Snowflake closing one Wednesday as a $60 billion company and opening Thursday as an $82 billion one, and Dell repeating the trick a day later with a 33% overnight repricing of a $205 billion business. His conclusion: no fundamental methodology on earth predicts moves like that — and no open-ended fund subject to redemptions can afford to fight them.
And then comes the confession that matters most for us. Smith writes that his time-honored technique — buying wonderful companies when they hit a temporary glitch, the way Buffett bought American Express during the salad-oil scandal — has become, in this market, an exercise in catching falling knives. The index-momentum machine takes every glitch and grinds it into a downward spiral. All you get, he admits, is cut fingers.
The consequences were not cosmetic. Portfolio turnover hit 51.8% in the first half — for a fund whose whole identity was «do nothing.» Out went Atlas Copco, Coloplast, EssilorLuxottica, Intuit, LVMH, Mettler-Toledo, Nike, Novo Nordisk, Otis, Unilever, Zoetis. In came GE Vernova, Legrand, Mastercard, Netflix, Sage, TJX, TSMC, Uber, Veeva — and, most interestingly for today’s story, AppLovin.
Now, here is the wrinkle that made us smile.
Guess what Fundsmith’s single biggest positive contributor was in the first half of 2026?
Fortinet. Plus 2.8 percentage points of attribution — more than the next two contributors combined.
Sit with that for a second. The one stock carrying the portfolio of the world’s most famous quality investor is a cybersecurity company that our screening ranks, as of this writing, as the highest-scored software name in our entire 810-stock universe. His quality process found the right business years ago. What it lacked was the second lens: the one that tells you which of your beautiful stories Mr. Market is actually honoring, and which ones he is quietly feeding to the ETF machine.
Zoetis, Coloplast and LVMH — three of his five biggest detractors — were all fundamentally «fine» companies. He sold all three. Some at a loss. That is what a missing chart lens costs.
Software Is a Battlefield
If you want to see this dynamic in its purest, most violent form, look at software.
«Markets are never wrong – opinions often are.» Jesse Livermore’s old line reads like the sector’s epitaph right now. And here is the mechanism behind it: markets can price bad news. They discount it, adjust, and move on. What they cannot price is uncertainty — a future they cannot model. Uncertainty is the kryptonite of stocks, a deadly overhang that no earnings beat can lift. And uncertainty is exactly what AI injected into software: nobody — not management, not the sell side, not Mr. Market himself — can model what the moat, the seat count, or the pricing power of a SaaS business will look like three years from now.
The result is a sector crawling with value traps. Businesses too cheap to ignore, too good to ignore — and still falling, quarter after quarter, because an unmodelable future keeps every rally on a leash. This is precisely why, in software more than anywhere else, you need both forces in your favor before a single franc goes in: the fundamentals and the tape. The Good Story tells you the business deserves to win. Only the Good Chart tells you the uncertainty overhang is actually lifting.
We have chronicled this war in real time. In «AI eats Software» we documented the carnage: Adobe down 70% from its highs while operationally firing on all cylinders. Intuit shedding nearly 20% in days. ServiceNow, Salesforce, DocuSign, Atlassian, HubSpot, Workday — all repriced double digits in a week, all with their Good Stories fully intact on paper.
Adobe deserves its own paragraph, because it is the purest specimen of the species. A business that tripled revenue and profits while its stock went nowhere for seven years, buying back nearly 10% of its own shares in a single year, priced by Mr. Market as if extinction were on the calendar. We dissected the dilemma in «Adobe: Value Trap or The Big Opportunity?» — and our answer then is our answer now: we don’t take sides between management and Mr. Market. We wait for the 200-day moving average to turn. Until the trend shifts, even the most beautiful story is a knife in mid-air.
And in «Software’s Good Story – and Why It’s Not Good Enough» we explained the deeper reason we refused to buy the dip anyway: because large language models introduced a structural uncertainty into the software business model — into the moat itself — that no earnings report has yet had to confess. The sector’s forward P/E compressed from north of 40x to roughly 20x. Adobe’s free cash flow yield exploded from 2% to over 10%. Cheap? Only if the cash flows are durable. And that is exactly what Mr. Market is questioning.
So here is the software battlefield in one sentence: dozens of businesses that look too cheap to ignore and too good to ignore — and a market that keeps selling them anyway.
Maybe it’s ETF flows. Maybe it’s the AI narrative. Maybe both, feeding each other. Honestly? For your portfolio, the why matters less than the what. Never underestimate momentum. Against you, it is a headwind that turns every glitch into a landslide. With you, it is a tailwind that makes everything easier — entries, exits, sleep.
Terry Smith learned this the expensive way, in public, with £11 million of voluntary dealing costs in six months.
You can learn it in one picture.
From 810 Names to Two Islands
This is what our screening was built for. Every one of the 810 quality compounders in the database is scored on two axes. The Good Story — moat, returns on capital, margins, organic growth, balance sheet, valuation, structural tailwind. And the Good Chart — price structure, accumulation versus distribution, relative strength, new highs, linearity. Fundamentals on one axis; Mr. Market’s verdict on the other. (The full manual lives here.)
Already a paid subscriber? Then everything in the screenshots below is already yours — live, right now. Go to screening.arvy.ch, enter the exact email address you subscribed with on Substack, and your personal access link lands in your inbox. No password, no setup — thirty seconds. The link stays valid for a month, and you can request a fresh one anytime.
The Screening (Stocks & ETFs)
Your complete guide to the arvy screening — the dual-lens tool behind every call we make. 800+ compounders, 300+ ETFs, and the framework that decides what we own.
Let’s zoom in — universe, sector, subsector — and watch the software problem sharpen at every level.
Level one: the whole universe. Sort all 810 names by Composite score and look at what dominates the summit: NVIDIA, Arista, KLA, Lam Research, TSMC, Broadcom, Applied Materials, ASML. The chip complex owns the leaderboard. And then, scattered among the silicon like guests at someone else’s party: two cybersecurity platforms, one chip-design software house, and one AI ad engine. Fortinet at 94.9 — the highest-scored software name in the entire universe, seventh overall out of 810. Cadence at 93.6. Palo Alto at 93.2. AppLovin at 91.3. That’s it. That is the complete list of software names living among the leaders.
Chart 1: The top of the arvy universe — 810 quality compounders ranked by Composite score. Count the semiconductor names, then spot the four software guests
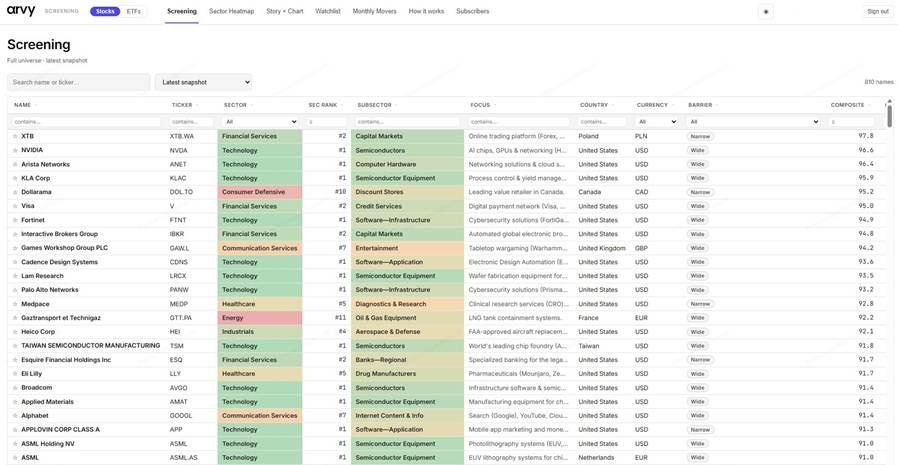
Source: arvy screening, screening.arvy.ch. Data as of 10 July 2026.
Level two: the sectors. The Sector Heatmap shows the paradox in one row. On the Composite lens, Technology ranks #1 of all eleven sectors — the story is intact. But flip to the pure Good Chart ranking and Technology drops to #9 of 11, behind Utilities, Industrials, Financials, even Real Estate. A sector that is first on fundamentals and ninth on trend is a sector at war with itself — one euphoric subgroup (the chips) masking a broken one (most of software) underneath. We called this the technology barbell in our semiconductor trilogy, and the heatmap is that barbell in color.
Chart 2: The Sector Heatmap — Technology ranks #1 on Composite but only #9 on the Good Chart lens: a sector at war with itself
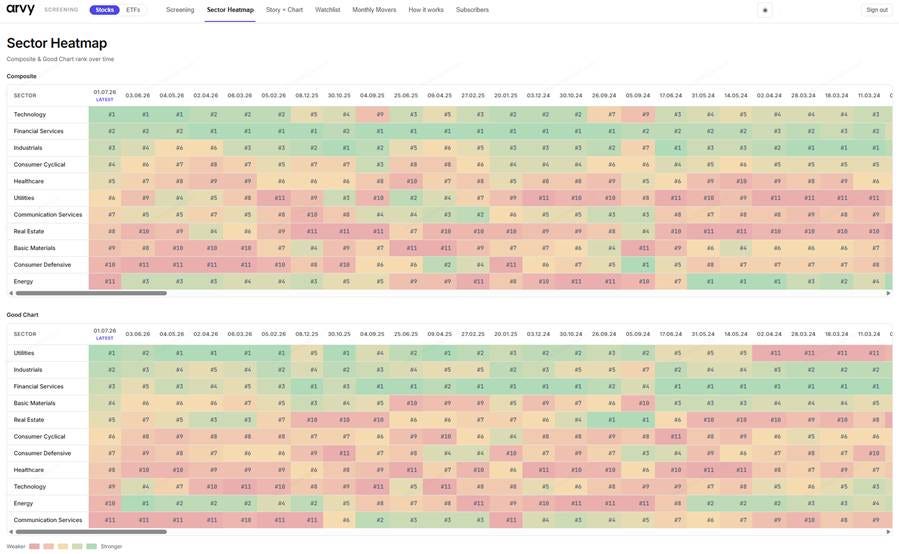
Source: arvy screening, screening.arvy.ch. Data as of 1 July 2026.
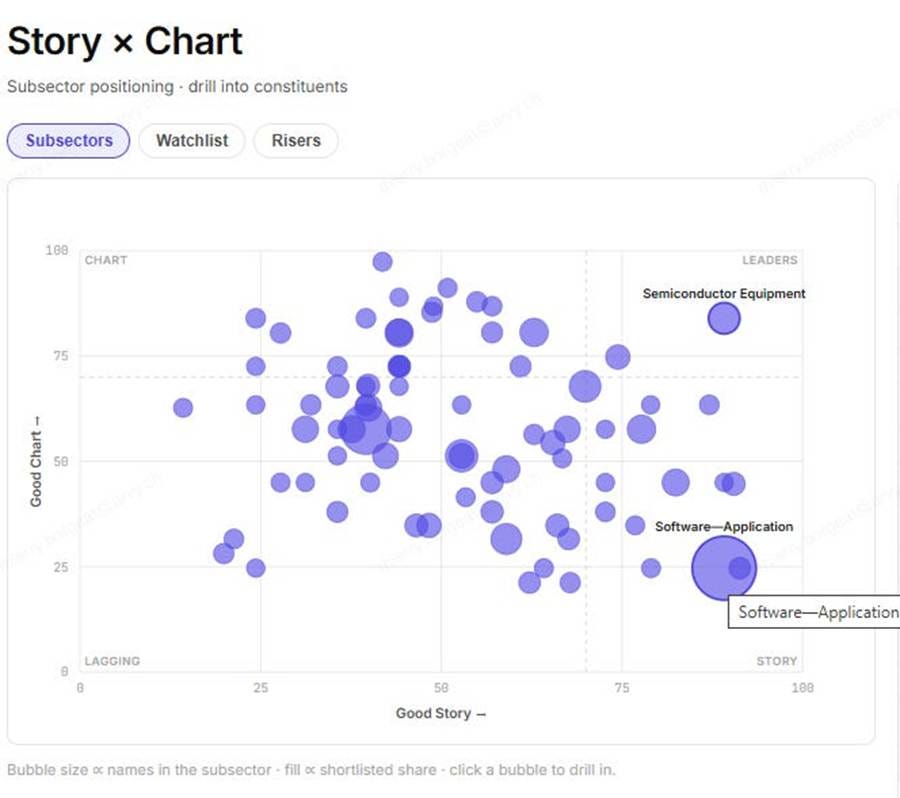
Level three: the subsectors. And here is the picture that should hang above every software investor’s desk. On the Story × Chart map, the Software—Application bubble sits at the far right of the horizontal axis — one of the strongest fundamental scores on the entire map — and near the very bottom of the vertical one. Elite story. Broken chart. Owning this bubble means owning great fundamentals against the trend: every day, the headwind. Now look up and to the right: Semiconductor Equipment, sitting squarely in the Leaders quadrant. Same market, same moment — story and trend aligned, the tailwind doing half the work.
Chart 3: The Story × Chart map — Software—Application: elite Good Story, broken Good Chart. Semiconductor Equipment: both, squarely in the Leaders quadrant
Source: arvy screening, screening.arvy.ch. Data as of 10 July 2026.
One caveat before anyone mortgages the house for chip equipment: semis are the tape’s undisputed leader, but as we laid out in «The Semiconductor Climax Run», they are also 22% of the S&P 500, absorbing record inflows, and tracing a textbook late-stage parabola. Where story and trend align most loudly is also where the music eventually stops loudest. That trend deserves participation with a plan — sell rules, not slogans — exactly as the trilogy describes.
Which brings us back to software. Because inside that broken sector, in the top-right quadrant where strong fundamentals meet a strong tape, two small islands glow.
Cybersecurity. And EDA — Electronic Design Automation, the software that designs the chips powering the AI boom itself.
Two places. In the entire software landscape, exactly two places where the story is excellent and Mr. Market says yes. Let’s visit both.
Island One: Cybersecurity — The Great Consolidation, Confirmed
Eighteen months ago, in «Fortinet & Palo Alto: The Only Constant is Change», we laid out the thesis: cybersecurity is the rare software subsector with a structural tailwind that AI strengthens rather than erodes. More AI means more attack surface, smarter attackers, and bigger breaches. Meanwhile the industry is absurdly fragmented — and organizations desperate to shrink 60–80 point solutions down to 15–20 platforms are consolidating their spend toward the two broad-platform pure-plays: Palo Alto and Fortinet. We called it the great consolidation.
Mr. Market has now delivered his verdict on that thesis. Loudly.
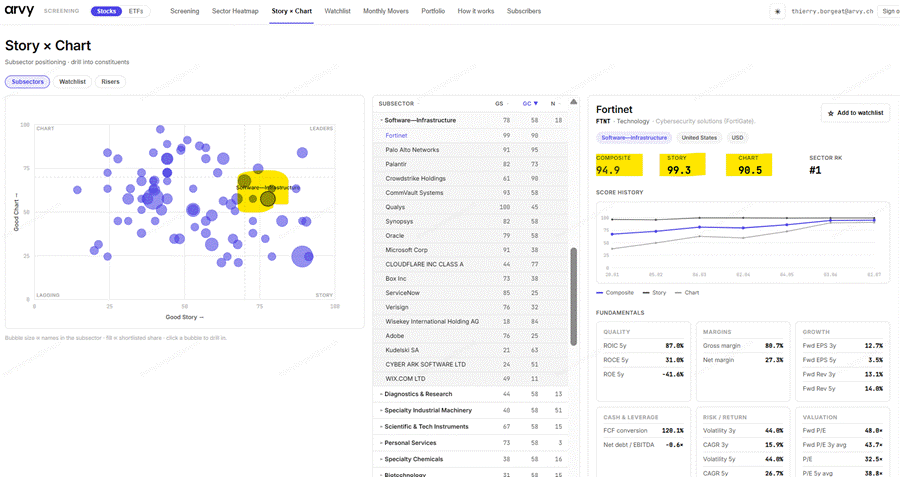
Fortinet scores a Composite of 94.9 in our screening — a Good Story of 99.3 paired with a Good Chart of 90.5 — making it, as shown above, the highest-ranked software name in the entire 810-stock universe, ahead of 803 other quality compounders. Palo Alto sits right beside it at a Composite of 93.2, with a Story of 91 and a Chart of 95. While the rest of software drowns, the market is actively accumulating the consolidators.
Chart 4: Fortinet in the arvy screening — Story 99.3, Chart 90.5, the top software name in the 810-stock universe, with Palo Alto directly behind
Source: arvy screening, screening.arvy.ch. Data as of 10 July 2026.
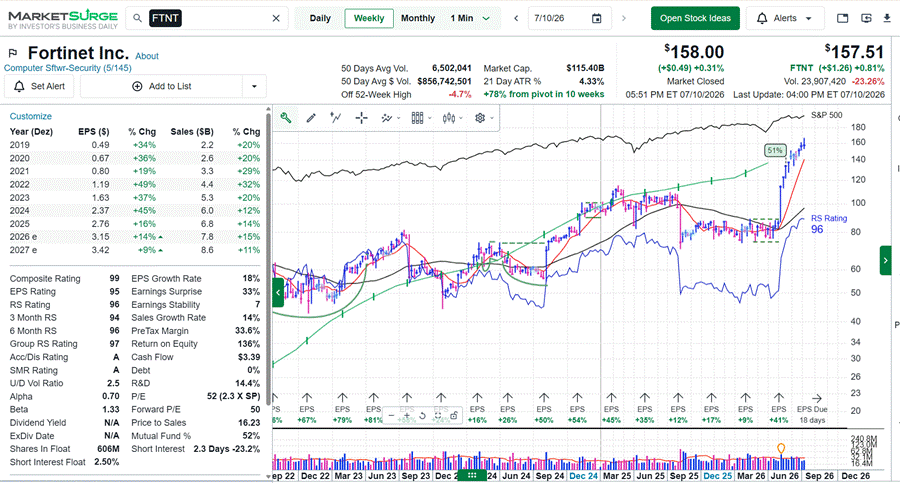
And the tape? Textbook. Fortinet broke out of its base ten weeks ago and now sits 78% above its pivot with a Relative Strength Rating of 96, zero debt, and a return on equity of 136%. This is what «Mr. Market says yes» looks like when he shouts it.
One honest word of discipline, though — the kind our O’Neil homework demands: a stock 78% above its pivot is extended. Confirmed leadership is not the same as an actionable entry. You buy leaders out of proper bases, not 78% up the mountain. Fortinet has earned its place at the very top of the watchlist; the next orderly setup earns your capital.
Chart 5: Fortinet (FTNT), weekly — 78% above its pivot in ten weeks, RS Rating 96, Composite Rating 99
Source: MarketSurge by Investor’s Business Daily, IBD Partner. Data as of 10 July 2026.
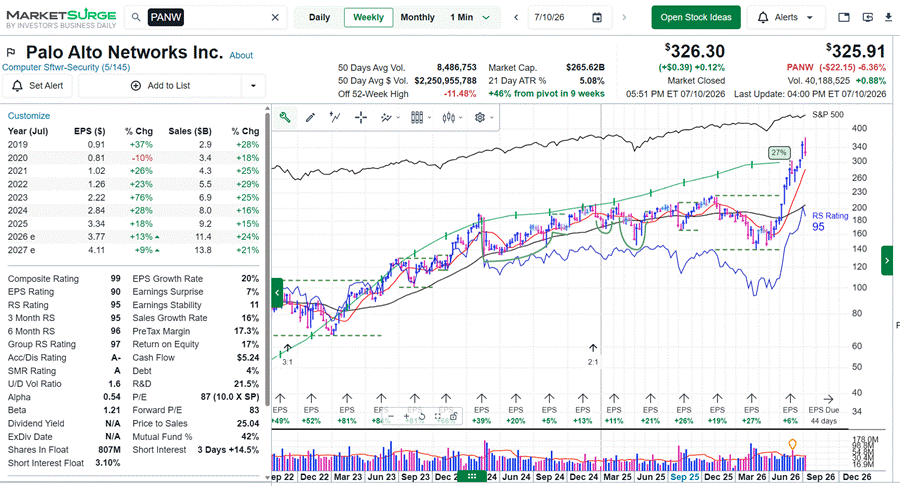
Palo Alto tells the same story one chapter earlier: 46% above its pivot in nine weeks, RS Rating 95, Composite 99, with earnings estimates still climbing. Two platforms, one consolidating industry, and a market voting with both hands.
Chart 6: Palo Alto Networks (PANW), weekly — 46% above its pivot in nine weeks, RS Rating 95
Source: MarketSurge by Investor’s Business Daily, IBD Partner. Data as of 10 July 2026.
And yes — this is the island where Terry Smith’s +2.8% of Fortinet attribution came from. His best idea of the half-year was a Good Story and Good Chart stock all along. He just didn’t have the second axis on his map to know how rare that combination had become in his own portfolio.
Island Two: EDA — The Shovel Makers Keep Winning
The second island should be familiar to longtime readers too. In «Cadence & Synopsys: The Duopoly That Never Loses a Client» we profiled the two companies that make the software with which every modern chip on earth is designed. A duopoly controlling roughly three quarters of the EDA market, with near-100% retention — clients leave when they go out of business, not when they switch — and 80–85% recurring revenue. In the great AI gold rush, these are the ultimate shovel makers.
Here is the beautiful irony: the same AI narrative that is eating application software is feeding EDA. Every new AI chip, every custom accelerator, every hyperscaler silicon project runs through Cadence and Synopsys tools. The disruption and the beneficiary are the same technology, one layer apart. And for anyone eyeing the semiconductor leaders with vertigo after our climax-run analysis, EDA offers something rare: the semiconductor tailwind through a toll booth — without owning the steepest part of the parabola.
Our screening scores Cadence at a Composite of 93.6 — Good Story 96.8, Good Chart 90.5 — the top Software—Application name in the entire universe, topping its subsector on the chart lens ahead of nearly forty application-software companies whose charts have been left for dead.
Chart 7: Cadence Design Systems in the arvy screening — Story 96.8, Chart 90.5, the top Software—Application name in the universe
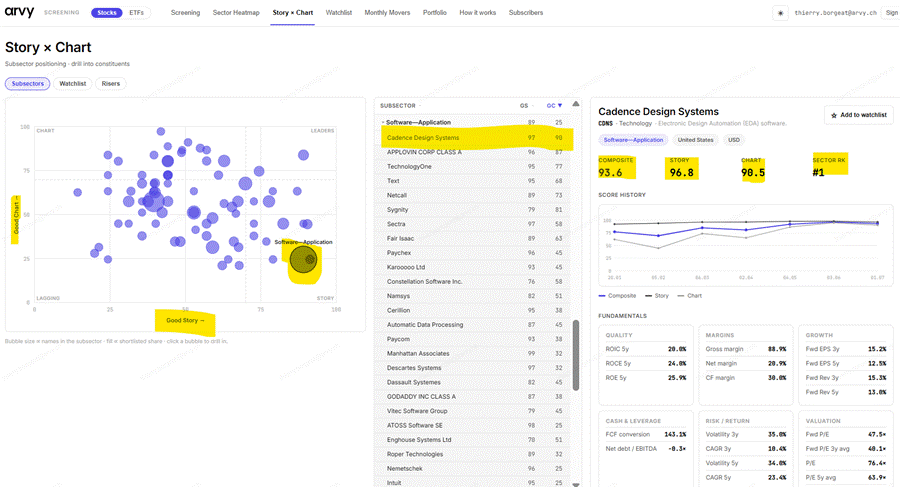
Source: arvy screening, screening.arvy.ch. Data as of 10 July 2026.
And unlike Fortinet, Cadence offers what chart discipline actually loves: freshness. The stock cleared a proper base eight weeks ago and trades just 2% above its pivot — 7.8% off its high, with double-digit earnings growth stretching estimated into 2027. Where Fortinet is the leader that already ran, Cadence is the leader still standing at the starting line of its move.
Chart 8: Cadence (CDNS), weekly — 2% above a fresh pivot after an eight-week base, Composite Rating 92
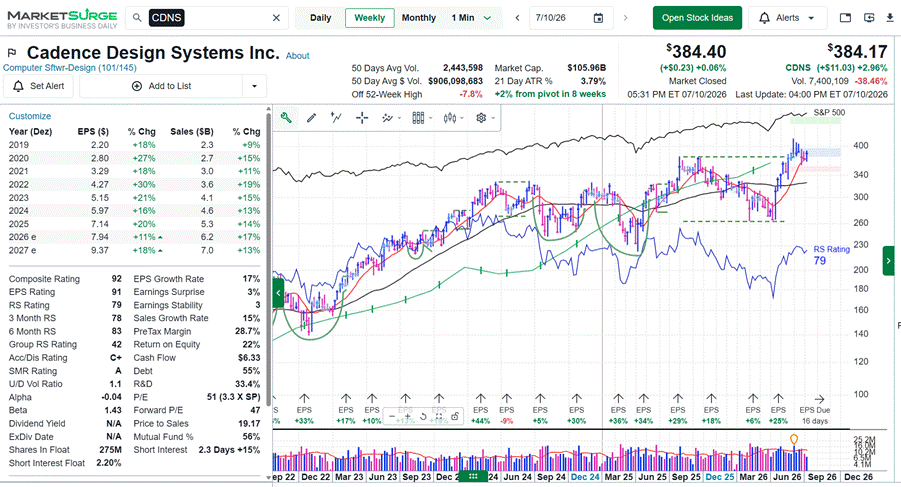
Source: MarketSurge by Investor’s Business Daily, IBD Partner. Data as of 10 July 2026.
Two islands. Cybersecurity, where AI feeds the threat. EDA, where AI feeds the demand. Everything in between — the CRMs, the design suites, the tax software, the collaboration tools — remains a battlefield where good stories go unrewarded.
«Ok Thierry — But What About AppLovin?»
I can hear you through the screen.
«Ok Thierry. Two islands, fine. But you said Terry Smith bought AppLovin — an ad-tech-software company — as part of his new momentum religion. Your screening gives it a Story score of 95.7. Fundsmith’s letter calls its AXON engine a moat with a return on invested capital above 100%. So is this the third island? Did the newly converted momentum investor just make his first great momentum buy?»
That is exactly the right question. And it has a precise, slightly uncomfortable answer.
Because when we put AppLovin under the dual lens — the same lens that just crowned Fortinet and Cadence — something remarkable shows up. One of the two scores is everything Terry Smith says it is. The other one is telling a very different story. And whether Fundsmith’s first momentum trade becomes a masterstroke or an expensive lesson depends entirely on which lens you trust.
Let’s look at the verdict.
AppLovin: A 95.7 Story Wearing an 86.8 Chart
First, the Story — and let’s be fair to Smith: it is spectacular. AppLovin’s AXON engine matches ads to users so profitably that the letter notes its advertising revenue exceeds Snap, Pinterest, Reddit and X combined. Earnings per share went from $0.98 in 2023 to $9.75 in 2025, with estimates of $16.11 for 2026 — up another 65%. Pre-tax margins above 70%. Our screening awards it a Good Story of 95.7 and it sits right at the top of its subsector on fundamentals. On quality alone, this belongs in any conversation with Fortinet and Cadence.
Chart 9: AppLovin in the arvy screening — Story 95.7, Chart 86.8, Composite 91.3
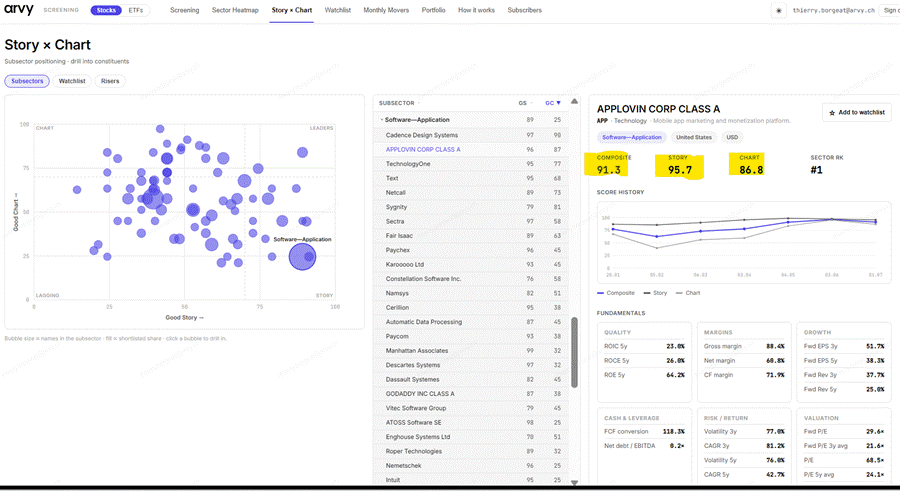
Source: arvy screening, screening.arvy.ch. Data as of 10 July 2026.
Now the second lens. And here the music changes key.
AppLovin’s Good Chart score of 86.8 is the weakest of our trio — still high in absolute terms, but the gap to its Story score is the tell. And the weekly chart explains why: the stock sits 32% below its 52-week high, with a MarketSurge Relative Strength Rating of just 55 — meaning nearly half the market has outperformed it over the past year — and it trades 18% below its next pivot. Where Fortinet broke out ten weeks ago and Cadence two months ago, AppLovin is still building the base. Institutional accumulation is visible (the Acc/Dis rating is a healthy B+), the earnings engine is roaring, but Mr. Market has not yet said yes. He has said: «interesting — show me.»
Chart 10: AppLovin (APP), weekly — 32% off its high, 18% below its pivot, RS Rating 55: a base under construction, not a breakout
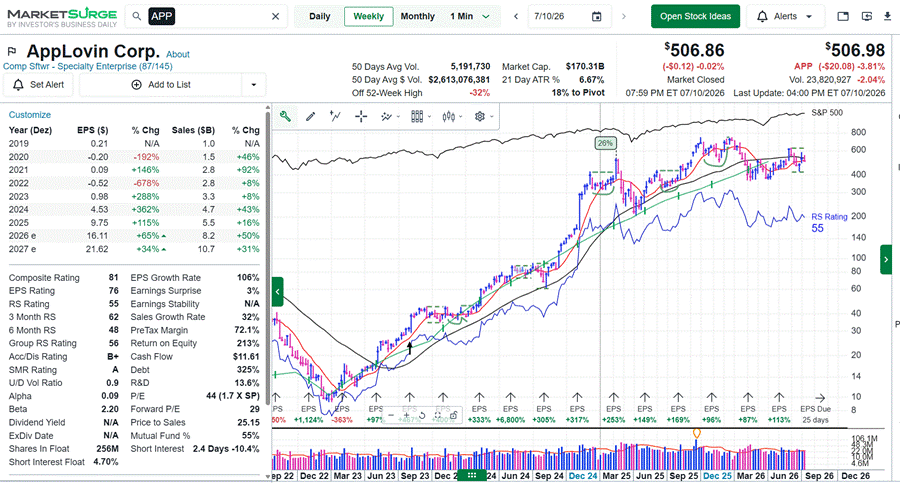
Source: MarketSurge by Investor’s Business Daily, IBD Partner. Data as of 10 July 2026.
Which brings us to the delicious irony of the summer of 2026.
Terry Smith announces, in writing, that he will henceforth respect momentum — and for one of his first purchases under the new regime he buys the one name in our trio where momentum has not yet confirmed. The RS-96 breakout (Fortinet)? He already owned it — his quality process got there first. The fresh-pivot leader (Cadence)? Not mentioned. The stock 32% off its high, mid-base, RS 55? That one he bought.
Old habits die hard. That is not a criticism of the business — it may even work out beautifully; bases are where great positions are born, and buying a high-quality base is a perfectly respectable strategy if you know that is what you are doing. But let’s call it what it is: a Good Story purchase with a chart thesis still pending. The newly minted momentum investor made a classic quality investor’s trade.
So here is our verdict, in the framework’s own language. Fortinet and Palo Alto: Story ✓ Chart ✓ — confirmed leaders; wait for the next proper setup. Cadence: Story ✓ Chart ✓ — and the setup is now, two percent above a fresh pivot. AppLovin: Story ✓ Chart pending — the trigger is the pivot roughly 18% overhead. If AppLovin clears that level on volume, the third island rises from the sea, and Mr. Smith will look prescient. Until then, it is a watchlist name — arguably the most interesting watchlist name in all of software — but a watchlist name nonetheless.
Precision over prediction. The screening does not tell you AppLovin will break out. It tells you exactly what has to happen before your conviction deserves your capital — and it will show you, in the score history, the moment Mr. Market changes his mind.
Run This Exact Analysis Yourself — In Minutes
Everything you just read took us minutes, not weeks, because the screening does the heavy lifting. Here is the workflow, so you can repeat it for any sector, any week:
Start on the Sector Heatmap. Composite and Good Chart rank for all eleven sectors, over time, in one color-coded grid. It tells you in ten seconds where momentum lives — and where a #1 story is hiding a #9 chart.
Open the Story × Chart map. Every subsector plotted on both axes. The software islands are visible in seconds — as is every crowd of value traps you should not touch.
Click a bubble, sort by Good Chart. Inside each subsector, the constituents rank instantly. That is how Fortinet 99/90 and Cadence 97/90 surface to the top while forty broken charts sink.
Open the stock panel. Composite, Story and Chart scores, the score history (watch how Fortinet’s chart score climbed for months before the headlines), plus quality, margins, growth, leverage and valuation — one screen, every number.
Then cross-check the setup on the weekly chart, exactly as we did above. Story first, chart second, entry discipline always.
And here is the point worth stating plainly. What Terry Smith just spent seventeen pages announcing — that a serious investor needs both the quality fundamentals and the momentum verdict of the market — is exactly what the screening was engineered to deliver, in one tool. The Good Story score measures precisely what Fundsmith hunts: moats, returns on capital, margins, organic growth, clean balance sheets. The Good Chart score measures precisely what he is now, finally, adding: trend, accumulation, relative strength — Mr. Market’s live verdict. He needed a painful half-year and 51.8% turnover to bolt the second lens on. You can have both lenses today, already combined, across 810 quality compounders and 300+ ETFs.
That is what a paid subscription actually buys: not only every deep dive we publish — the flagships, the trilogies, the head-to-heads — but the screening itself, with the Sector Heatmap, the Story × Chart map, the full «how it works» manual, and the complete live arvy portfolio sitting right next to the engine that generates it. If this article saved you from one falling knife, it paid for itself several times over.
Here is exactly how to get in — it takes thirty seconds:
If you are already a paid subscriber: you have full access this very moment — no extra payment, no password. Open
screening.arvy.ch, type in the exact email address Substack has on file for you, and your personal access link arrives by mail. Valid for a month; request a fresh one anytime. (Reading this and never logged in? Today is the day — you have been paying for it.)
If you are not yet a paid subscriber: upgrade in one click below, then head to the same address with the same email. You will be running the software map yourself before you finish your coffee.
Subscribe and unlock the screening →
Reader Q&A
«If momentum is now driving everything, why not just buy a momentum ETF and be done with it?»
Because momentum without quality is how you end up owning the unprofitable end of the Russell 2000 at the top. Smith’s letter itself shows loss-making companies outperforming profitable ones — that is momentum in its purest, most dangerous form. Our answer is the intersection: only names that pass the quality gauntlet and carry Mr. Market’s blessing. The Story keeps you out of junk; the Chart keeps you out of traps. You need both, precisely because each one alone fails in a different, expensive way.
«Isn’t buying Fortinet after a 78% run exactly the momentum-chasing you warn about?»
Yes — which is why we said wait. Leadership identification and entry timing are two different jobs. The screening identifies the leader; O’Neil-style base discipline times the entry. Fortinet at 78% above pivot is a hold-if-you-own-it, not a buy-if-you-don’t. Cadence at 2% above a fresh pivot is what an actionable leader looks like. Same islands, very different entries.
«Does Terry Smith’s pivot mean quality investing is dead?»
Quite the opposite — it means quality investing alone is incomplete. Smith is not abandoning quality; his new purchases still average 30%+ returns on capital. He is adding a second lens, fifteen years late, under duress, with 51.8% turnover as the tuition fee. The lesson is not «abandon fundamentals.» The lesson is: fundamentals tell you what deserves to win; the tape tells you what is winning. Insist on both.
Let’s bring it home.
The most disciplined «do nothing» investor of our era just conceded, in writing, that in a market where passive flows set prices, sitting on unloved quality is not stoicism — it is negligence with better PR. His best position of the half-year was a stock our dual lens ranks first in its sector. His newest purchase is a stock our dual lens says is not ready yet. Both facts point the same way.
Software remains a battlefield: full of businesses too good to ignore and too unloved to own. On the whole map, only two islands rise above the waterline — the security consolidators and the chip-design shovel makers — with a possible third, AppLovin, still under construction and worth watching like a hawk. The chip complex itself remains the tape’s loudest trend — parabola, warning label and all.
Great business. Willing market. Demand both — and let the tailwind do half your work.
And if you want both lenses on your own screen — every deep dive we publish, plus the screening with its 810 quality compounders and 300+ ETFs — the door is one click away:
Subscribe and unlock the screening →
Love,
Thierry and Team arvy
The arvy Ecosystem — Referenced in This Piece
• The Screening (Stocks & ETFs): the complete guide to the dual-lens tool behind every call in this article —

• Fortinet & Palo Alto: The Only Constant is Change: our January 2025 thesis on the great cybersecurity consolidation —

• Cadence & Synopsys: The Duopoly That Never Loses a Client: the shovel makers of the chip gold rush —

• AI eats Software (the end of it?): our real-time chronicle of the sell-off and why we didn’t catch the knife —

• Software’s Good Story – and Why It’s Not Good Enough: the structural case against buying the dip —

• Adobe: Value Trap or The Big Opportunity?: the poster child of the software repricing — and why we wait for the 200-day to turn —

• The Semiconductor Climax Run (Part 1 of 3): where the tape leads — and how to read the end of a great trend —

• Fundsmith Equity Fund, Semi-Annual Letter 2026: Terry Smith’s letter, in full and worth every minute —
The screening is a research tool, not investment advice. Holdings shown reflect arvy’s positioning and may change. Past performance is not a reliable indicator of future results. arvy AG is authorised by FINMA as a manager of collective assets under CISA Art. 24.
Legal Notice: At the time of publication of this article, the companies mentioned may or may not be portfolio holdings of arvy. Such securities may or may not be included in the portfolio at any point in the future. This document has been prepared solely for informational and marketing purposes and does not constitute an invitation, offer, or recommendation to acquire or sell any financial instruments or to engage in any other transactions. The relevant prospectus and key investor information documents (e.g. PRIIPs KID / Key Information Document) are available free of charge from arvy AG.
"For fifteen years, Fundsmith’s mantra was «Buy good companies. Don’t overpay. Do nothing.» On the first of July 2026, the third leg broke. Terry Smith told his investors that he will now take momentum into account — and started buying names like AppLovin."
And, of course, the obvious sentiment interpretation from this announcement is that momentum is over. Funds closing, blowing up, or changing their investment strategy have a long history of marking turning points.